Network Visualisations of 38.000 Letters of 19th Century Intellectuals
CORE AdminEvery bit of information that is entered into nodegoat can immediately be published through a public user interface. This allows the Encyclopedia of Romantic Nationalism in Europe to instantly publish articles and a wide range of research data. This data also includes a set of over 38.000 letters that can be queried through the public user interface. In this blogpost we discuss the steps we took to allow visitors to dynamically explore this dataset.
The Study Platform on Interlocking Nationalisms (SPIN) at the University of Amsterdam has created a dataset of metadata of over 38.000 letters of nineteenth century intellectuals. This data has been manually entered and imported semi-automatically (geo-referencing and disambiguating people was largely done by hand). Sources include a range of publications of letters, like Breve fra og til Carl Christian Rafn, med en biographi, plus two existing datasets: (1) the metadata of over 18.000 letters of Jacob and Wilhelm Grimm were provided by the Arbeitsstelle Grimm-Briefwechsel Berlin, and (2) the metadata of over 14.000 letters of Sir Walter Scott were provided by the Millgate Union Catalogue of W. Scott Correspondence; courtesy prof. Millgate & National Library of Scotland. The remaining 6.000 letters were entered by hand by SPIN, based on publications of letters of various other intellectuals throughout Europe. This means that the dataset is a combination of a number of personal networks and that we have an overrepresentation of letters sent by the people at the center of these personal networks.
This dataset is part of the Encyclopedia of Romantic Nationalism in Europe (ERNiE). ERNiE will include over 1.500 articles on topics and people associated with the era of romantic nationalism (e.g. Dress, design : Romanian, Karadžić, Vuk Stefanović, Felicia Hemans). ERNiE also includes other materials like monuments, architecture, art, and currency. ERNiE is coordinated by SPIN. The editor of ERNiE is Joep Leerssen.
These people sent/received most letters in the dataset:
| Person | Letters | |
|---|---|---|
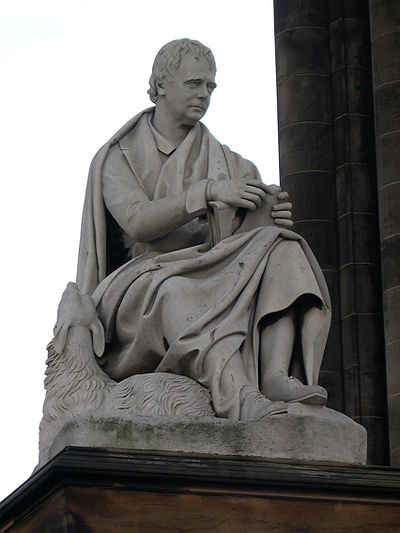 | Sir Walter Scott | 14.050 |
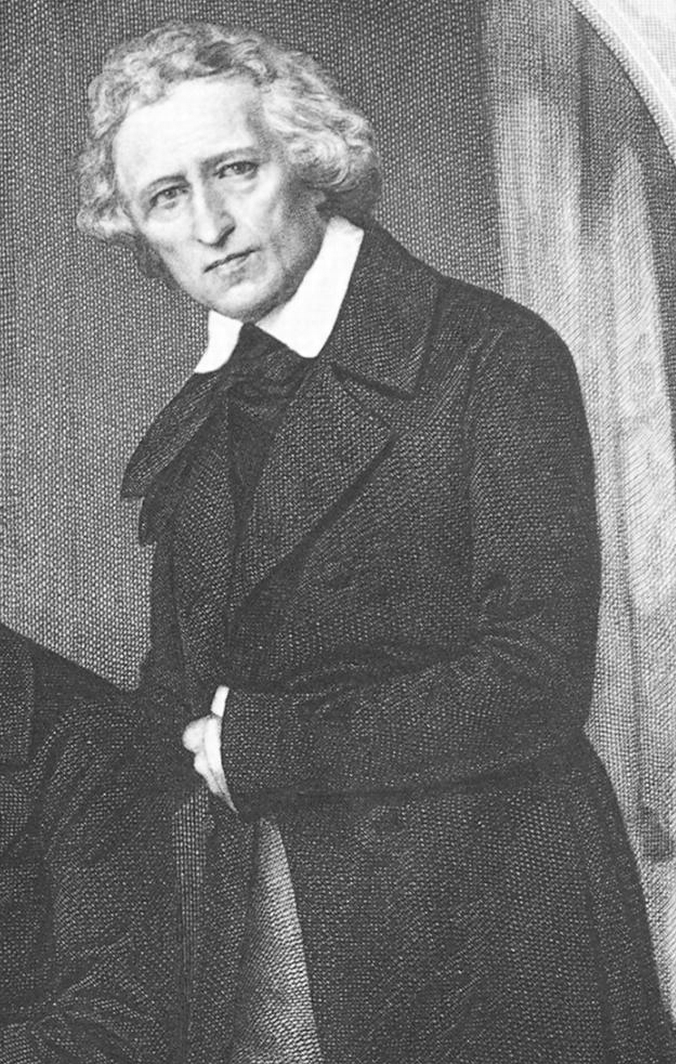 | Jacob Grimm | 13.156 |
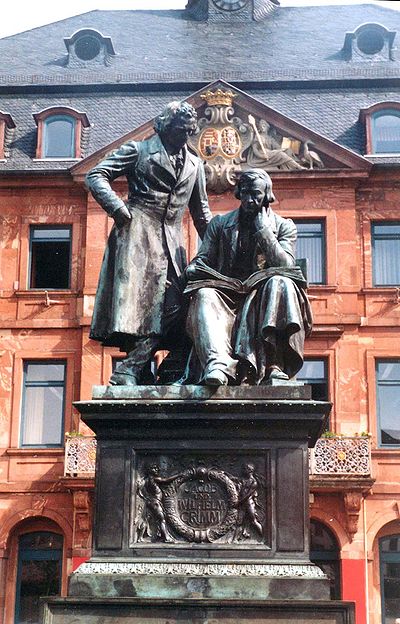 | Wilhelm Grimm | 5.867 |
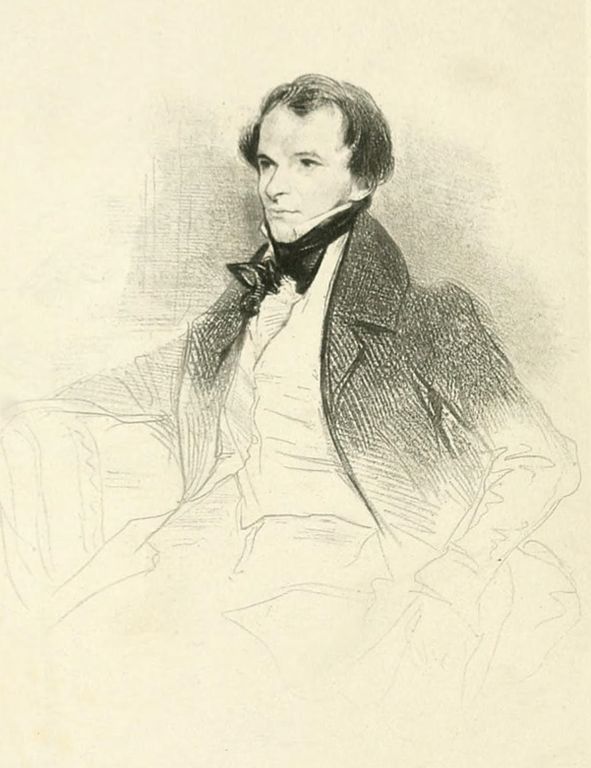 | Prosper Mérimée | 2.232 |
 | Ernst Moritz Arndt | 1.722 |
| Georg Friedrich Benecke | 726 | |
| Robert Cadell | 665 | |
| James Ballantyne | 642 | |
| Salomon Hirzel | 548 | |
| Dorothea Wild-Grimm | 451 | |
| Eugénie de Montijo | 442 | |
 | Pavel Jozef Šafárik | 411 |
| Paul Wigand | 410 | |
 | Friedrich Carl von Savigny | 408 |
Challenge: how do we sensibly visualise this data?
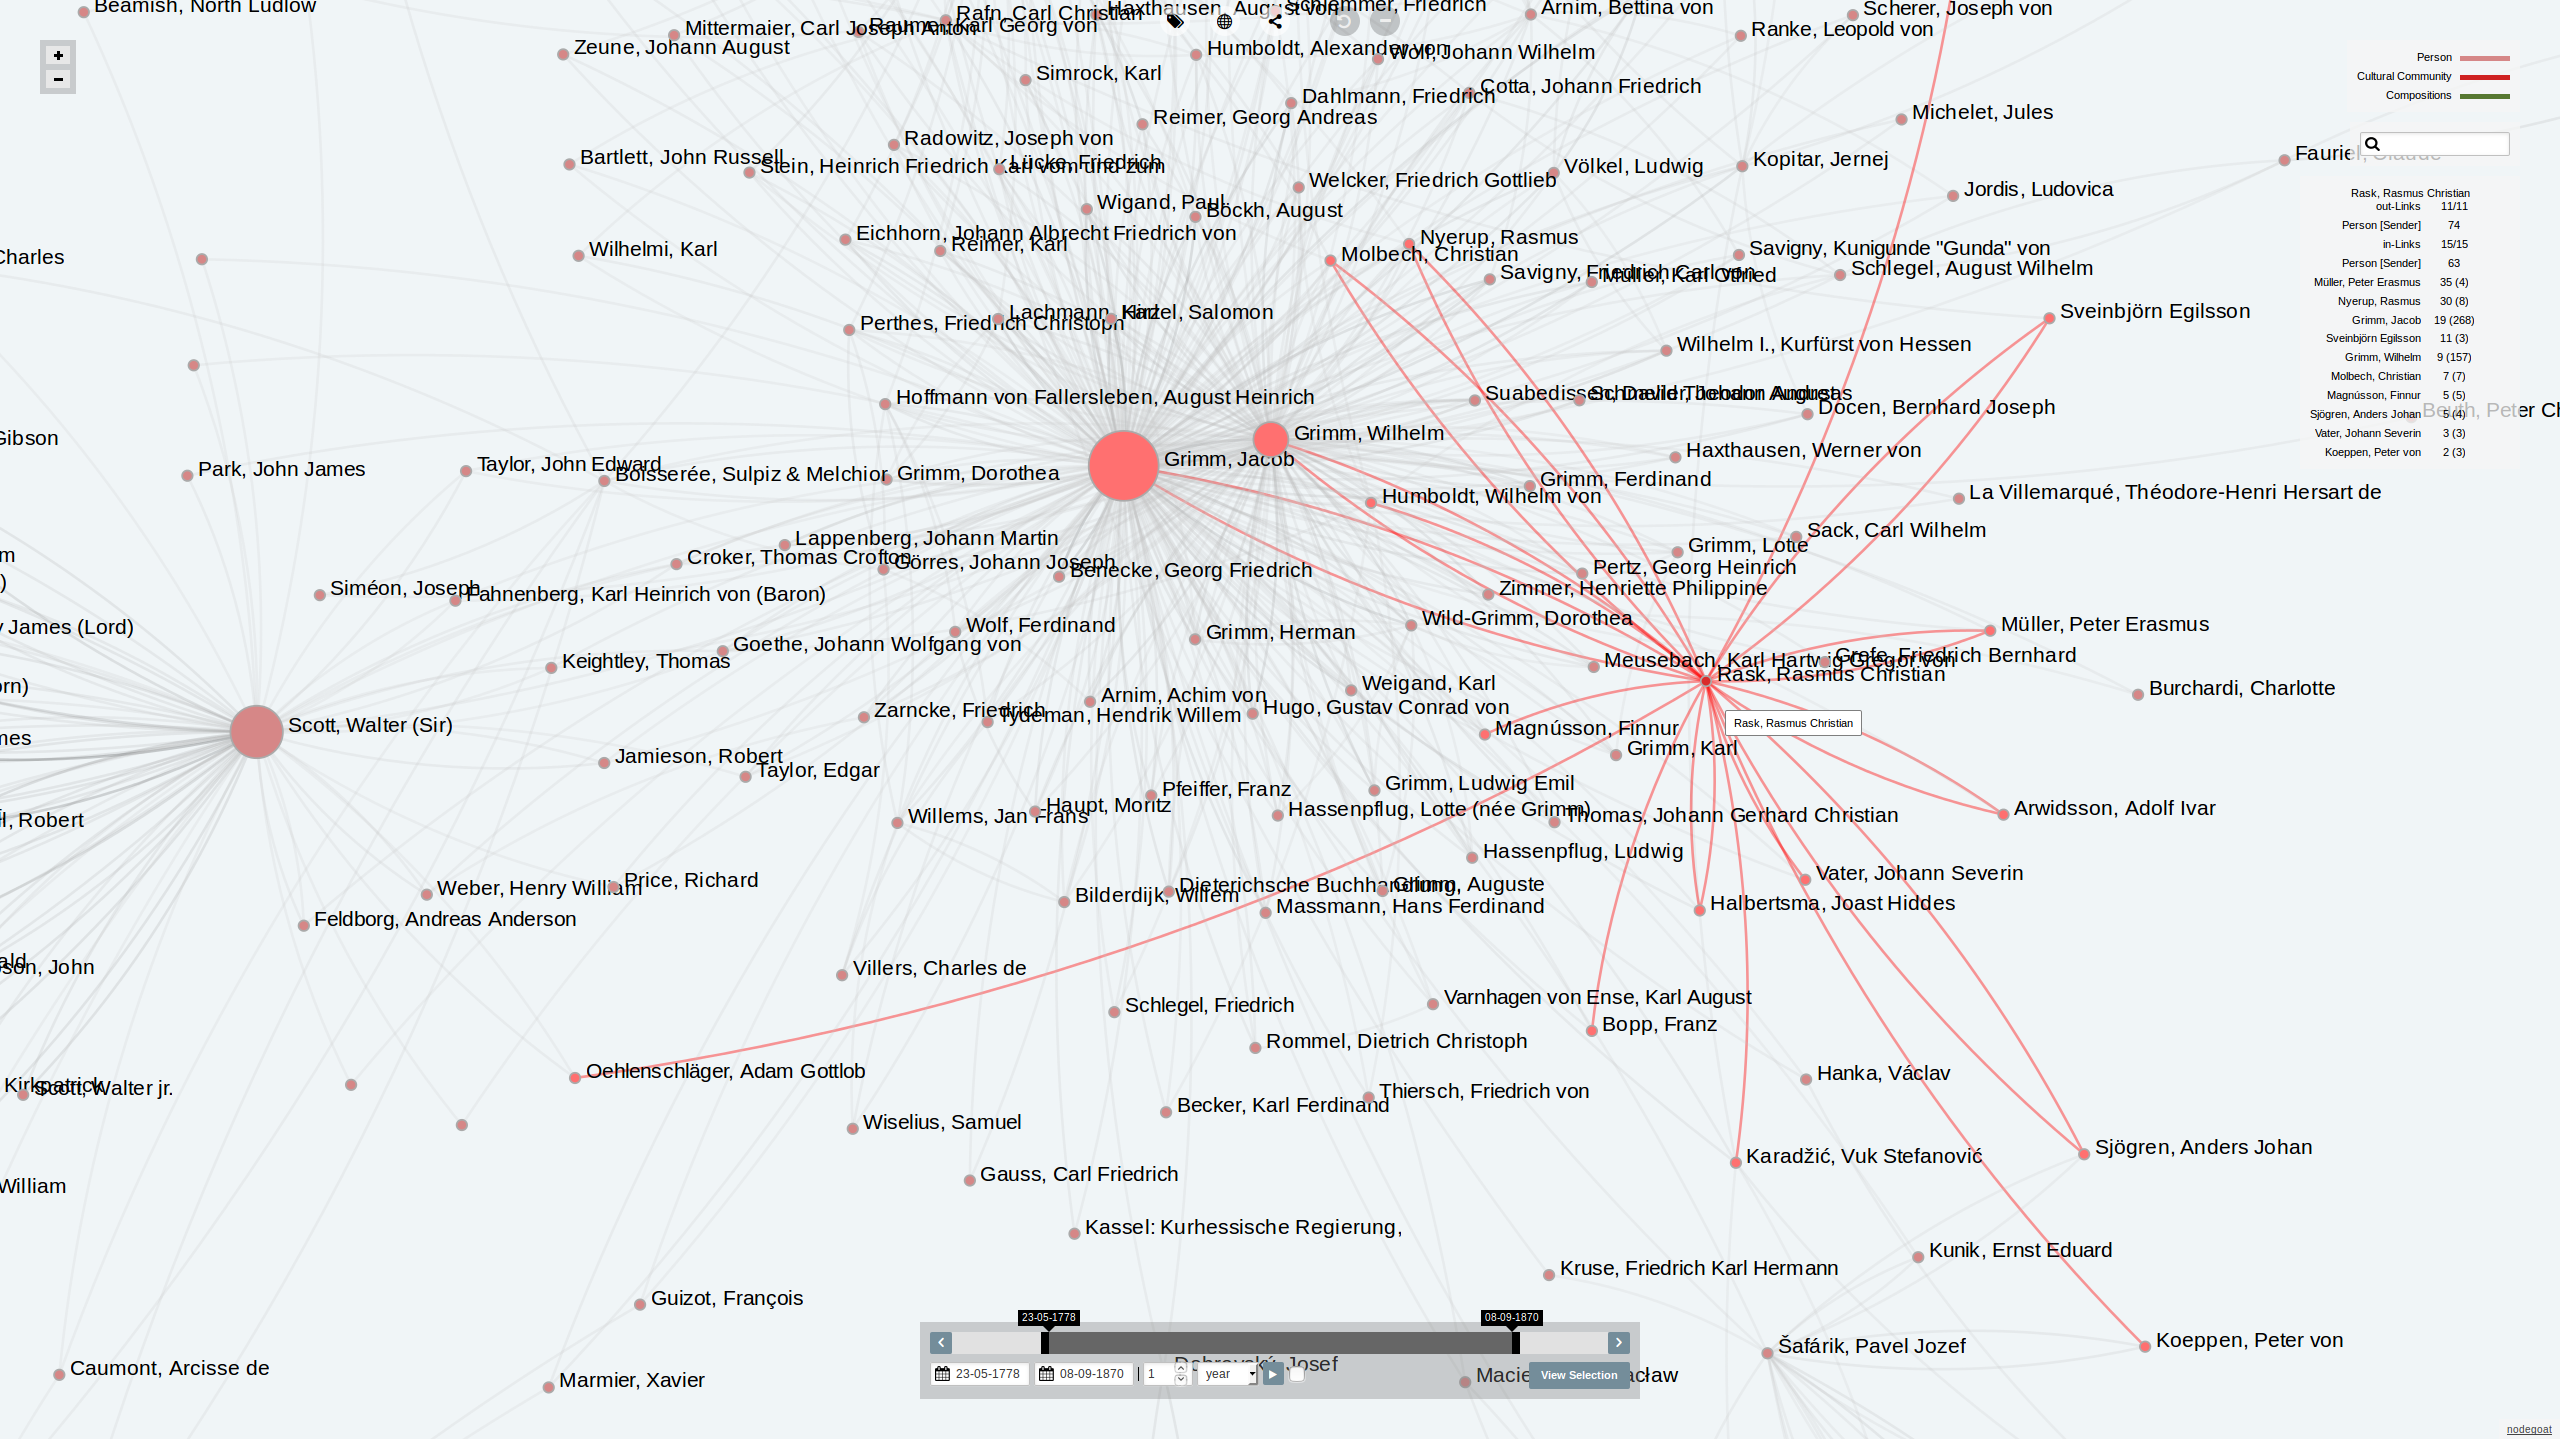
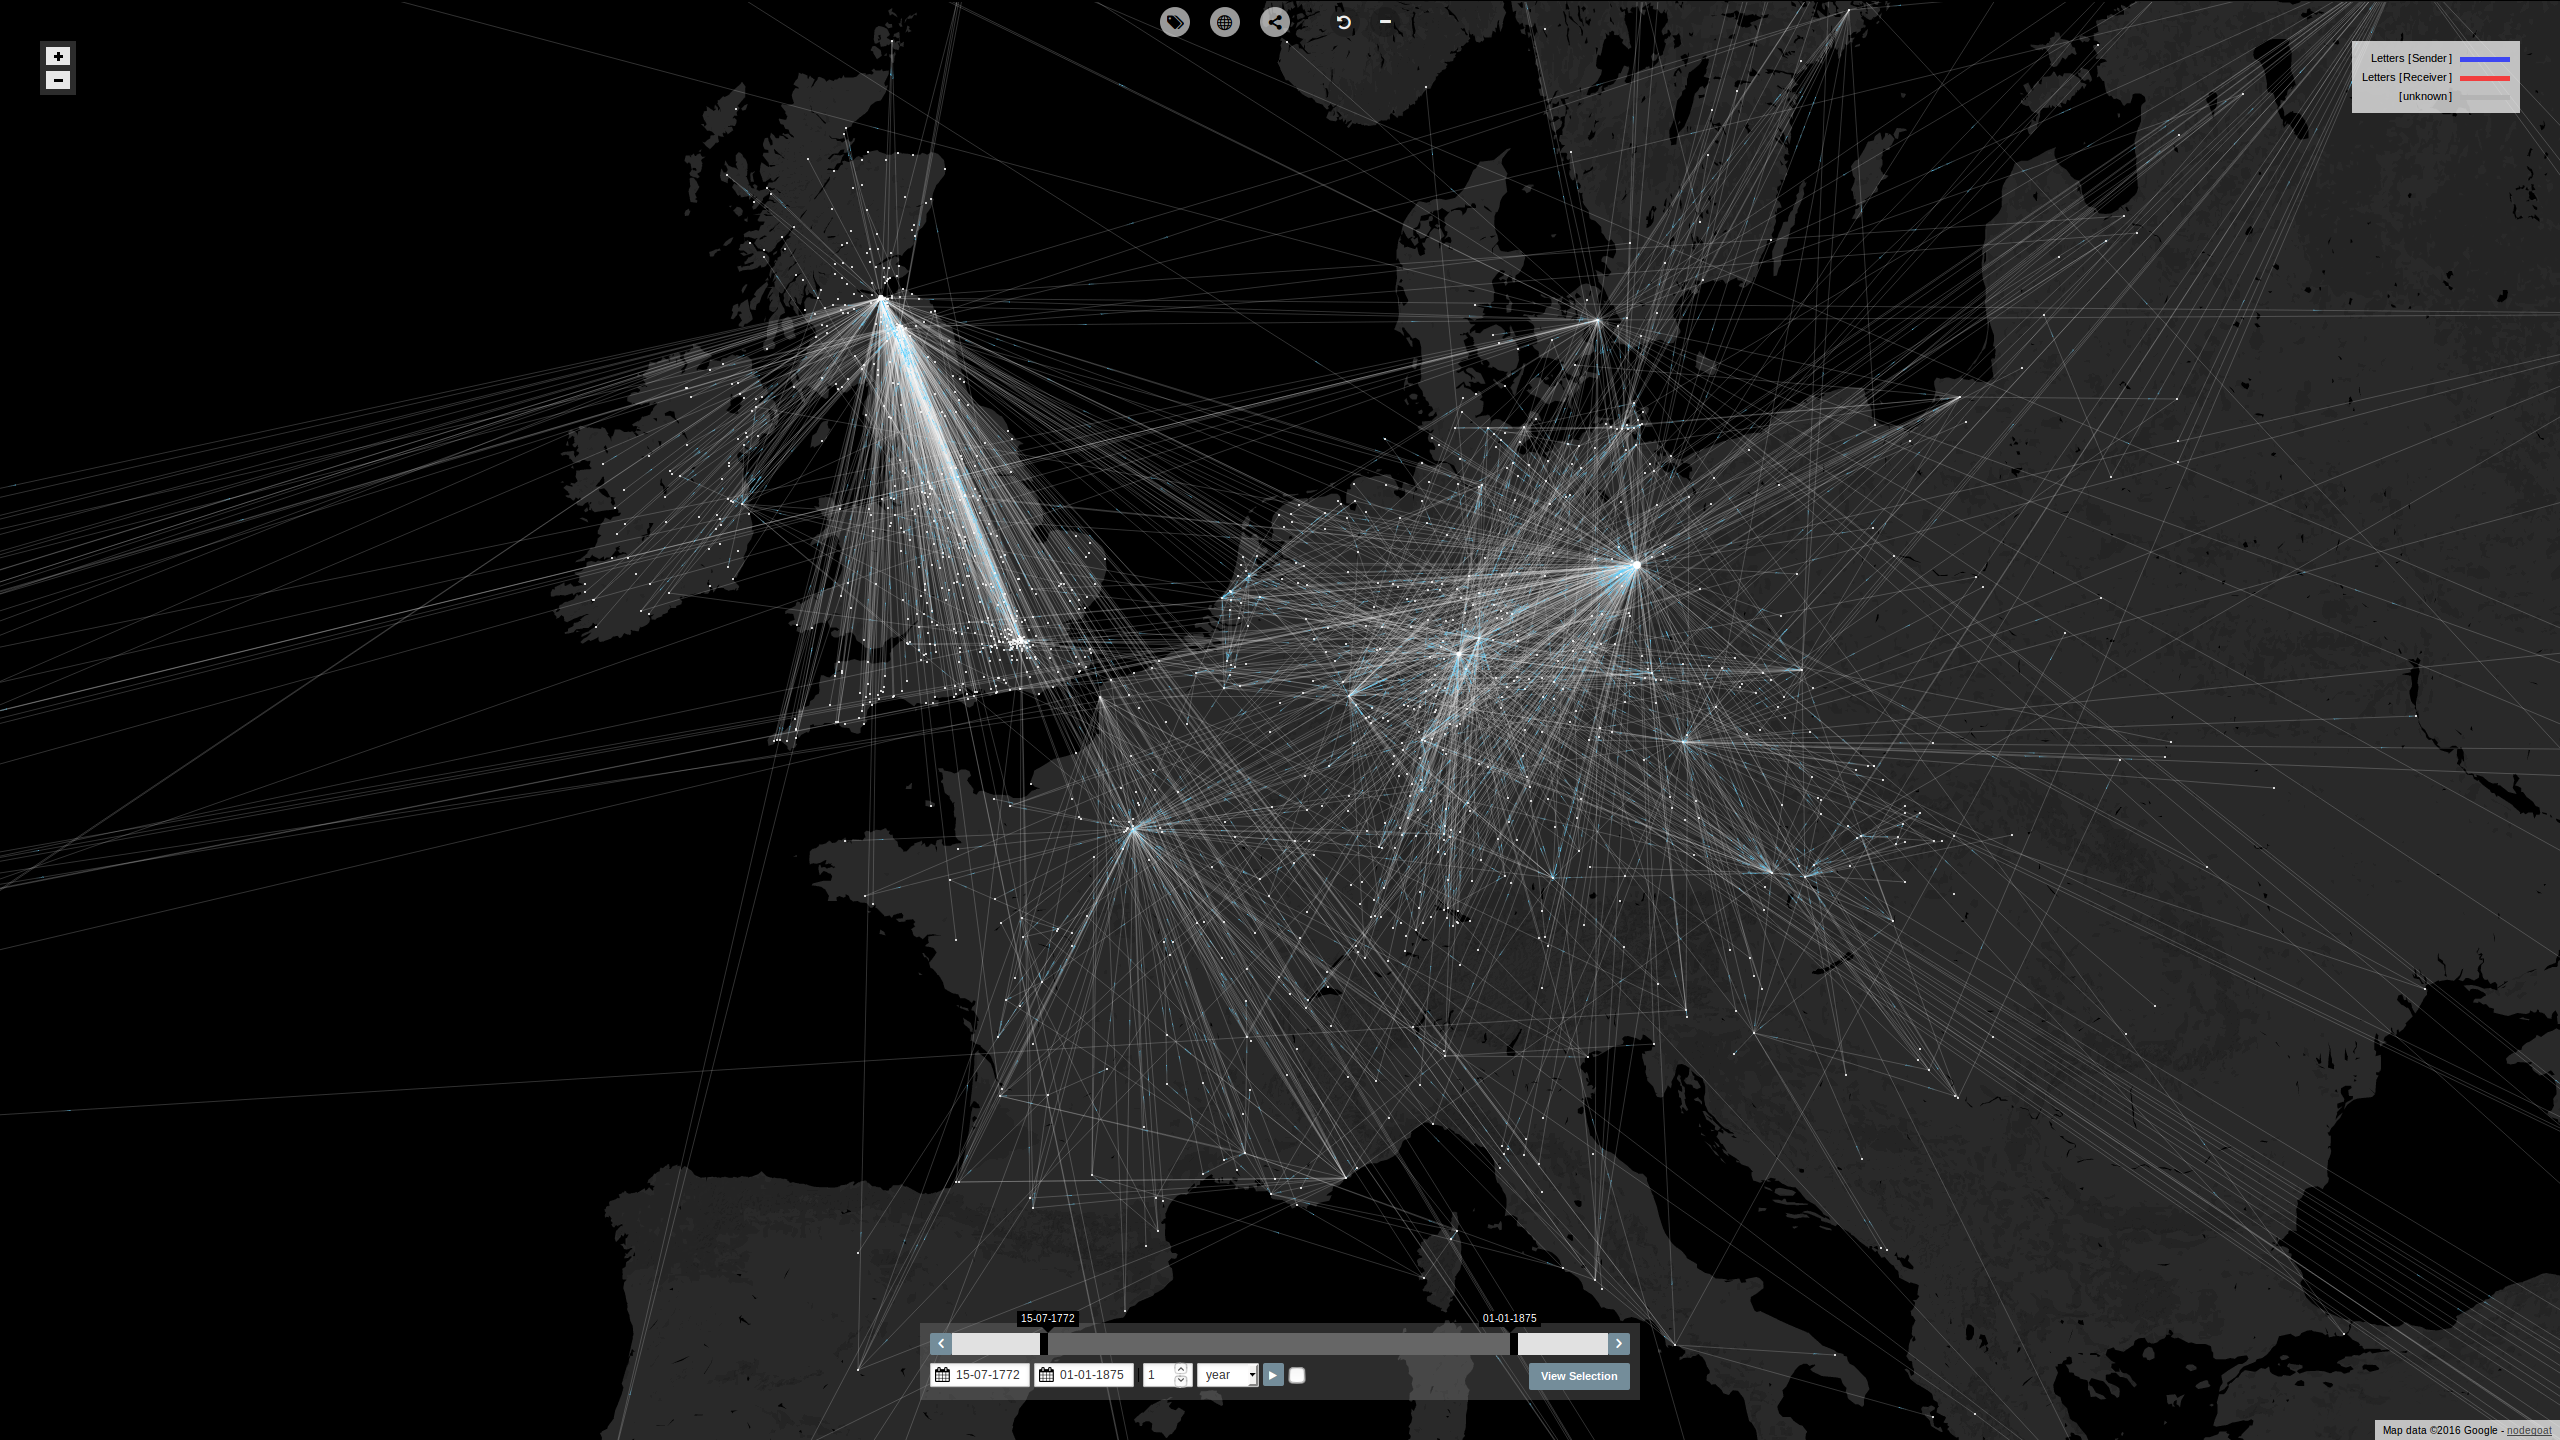
A geographic visualisation of an epistolary network of a single person makes sense, as can be seen in the visualisations above (click on the number of letters sent/received). We can also animate the directionality of these letters, for example in the network of Carl Christian Rafn. The diachronic component makes these visualisations even more useful. A social graph of an epistolary network of one person is less useful since this mainly conveys information on the intensity of relations which can better be presented in an ordered list.
By combining multiple personal epistolary networks in a single social graph, we can identify connections between various networks. However, if we show all the people and their letters in a single graph, we also visualise a lot of noise. This noise consists of 'dead-ends' in the personal networks: people who are connected to a single person only. This data is not helpful while looking for connecting figures and additionally uses bandwidth/computational power.
If we want to filter out this 'noise', we cannot rely on the number of letters one person has sent or received. A person who has sent/received only five letters may still have an important role in connecting two networks that would otherwise be disconnected. Filtering down on betweenness centrality metrics could work here but this is computationally a very expensive algorithm. Since the dataset is active and will receive constant updates (new data is added / users can scale the selection through time), we cannot work with pre-calculated values and have to be able to generate the visualisation dynamically.
Identifying the hubs
Simply put: to visualise the interconnectedness of these various epistolary networks, we only want to include people in the the visualisation who transcend personal networks. Of all the authors in the Grimm Brothers dataset 92% of them are connected to Jacob and/or Wilhelm only. The remaining 8% has also sent/received letters to other people in the complete dataset. These are the people we wish to include in the social graph since the others are not connected to other people in the dataset. To achieve this, we need a filtering mechanism that finds people who sent/received letters to one or more person.
This is easier said than done due to the fact that the amount of people one person is connected to can only be known by comparing all the people this person is connected to, via all the letters they sent/received. So if one person is connected to 20 letters, we have to check all these 20 letters to see how many unique people this person is connected to.
To get around this exponentially growing complexity, we identified the main hubs in the dataset (persons whose letter publications have been entered). We then filtered on correspondents who had sent/received a letter to one of these 'hubs' plus another person. We used these filters as reversed classifications to be able to use them dynamically. This allowed us to get rid of all the 'dead-ends' in the large sets of the Grimms, Merimee, Scott, Arndt, and others.
Comments
Add Commenthi i want to know Islands of Tiran and Sanafir
it has a maps It describes the trace to any country