Labour, accountability and social impact of public buildings in premodern times
CORE Admin
Pierluigi Terenzi (University of Florence) Through the case study of the Opera di Santa Maria del Fiore in the second half of the 14th century, the project LASI - Labour, accountability and social impact of public buildings in premodern times, led by Pierluigi Terenzi and Marco Bellucci (University of Florence), aims to outline a model of public work organisation capable of having a positive impact on building objectives and on the city’s social fabric, and representative of a set of good practices capable of responding with resilience to the crises produced by epidemics, wars and famines. The analysis of past experiences that were able to overcome harsh economic, demographic and social criticalities intends to contribute to the reflection on decision-making options for today’s policy makers, on corporate social responsibility and on the adaptability required of employers and workers. The project aims to identify the elements that enabled the Opera, despite the difficulties, to complete the works entrusted to it, among which the cathedral stands out; and it intends to verify the hypothesis that the reasons for this success lay in the system of work and labour management, the constituent elements of which can be traced back to the mid 14th century. The objective will be achieved by setting up a reference scheme that considers: the organisation of the workers; labour relations and their reporting; administrative practices of planning and control; social responsibility and ante litteram welfare policies; the accountability and transparency required in the management of public resources; the involvement of the territory's socio-economic actors, with the consequent social impact. These potential good practices will be discussed from a historical and corporate perspective in order to draw ‘lessons from the past’, useful in the exceptional period we are currently experiencing to suggest approaches and solutions to the crisis.
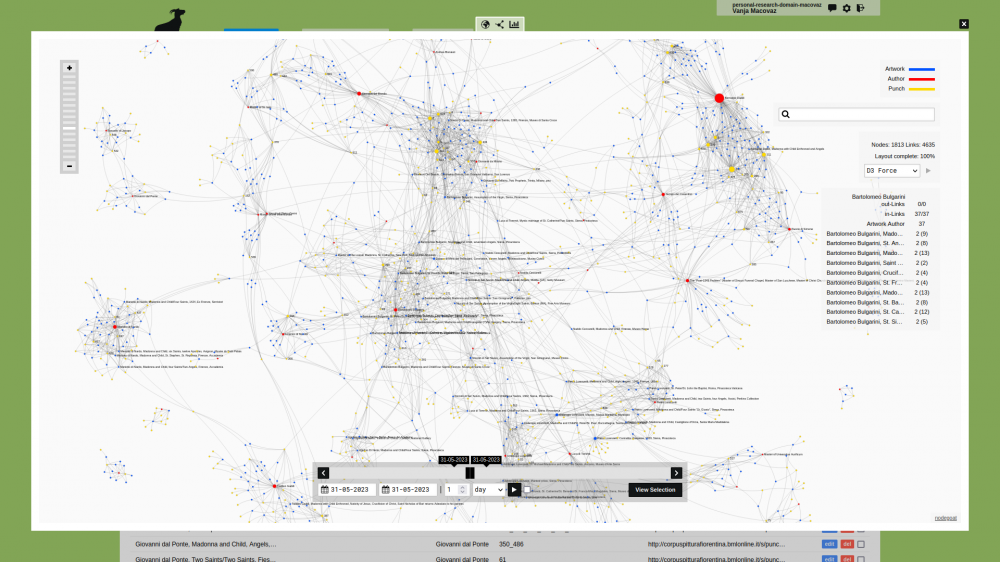
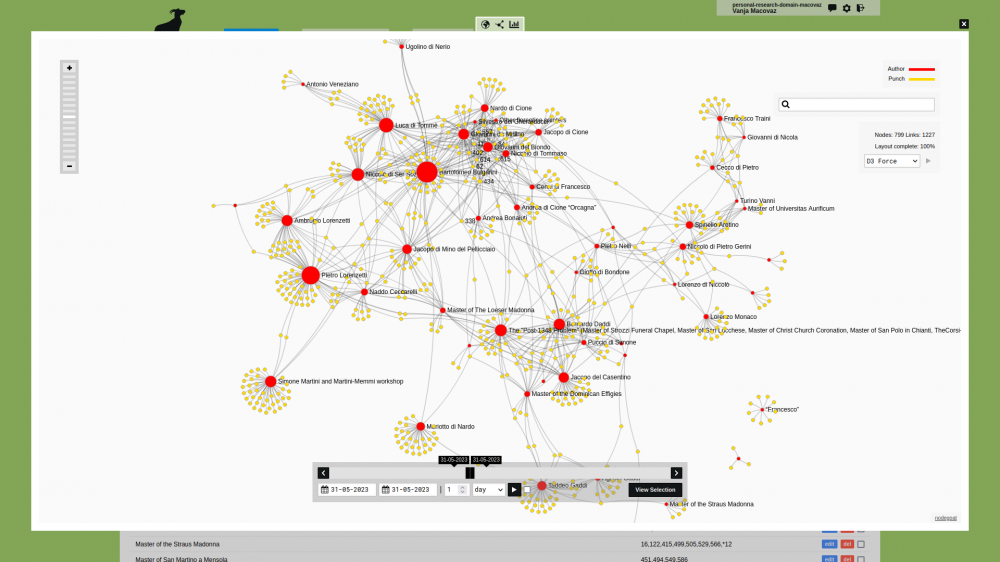
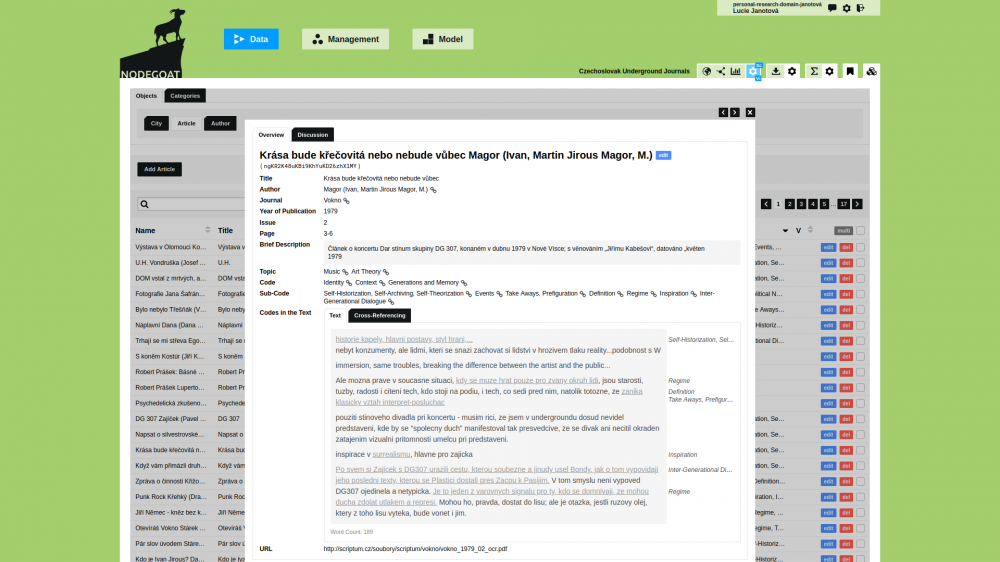
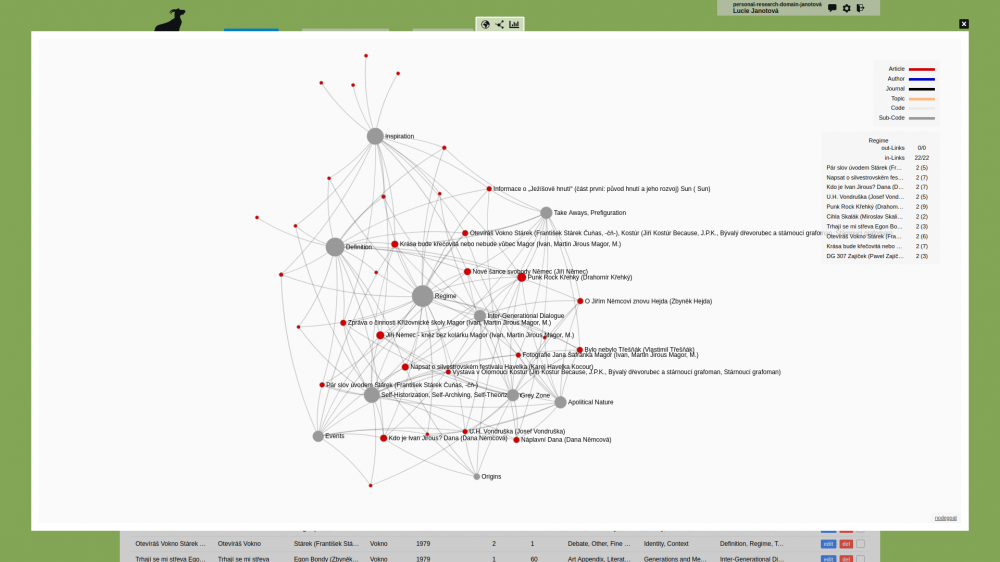
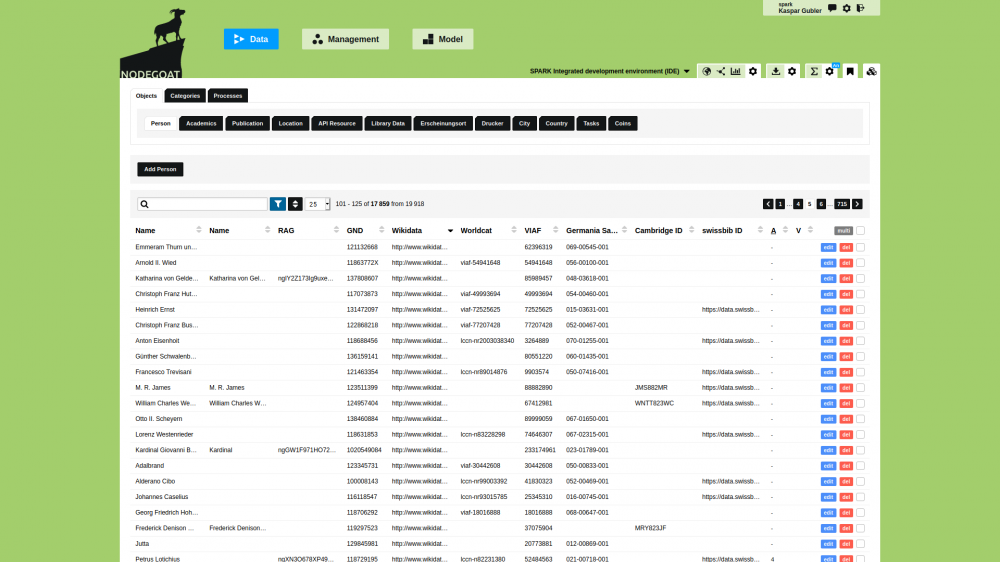
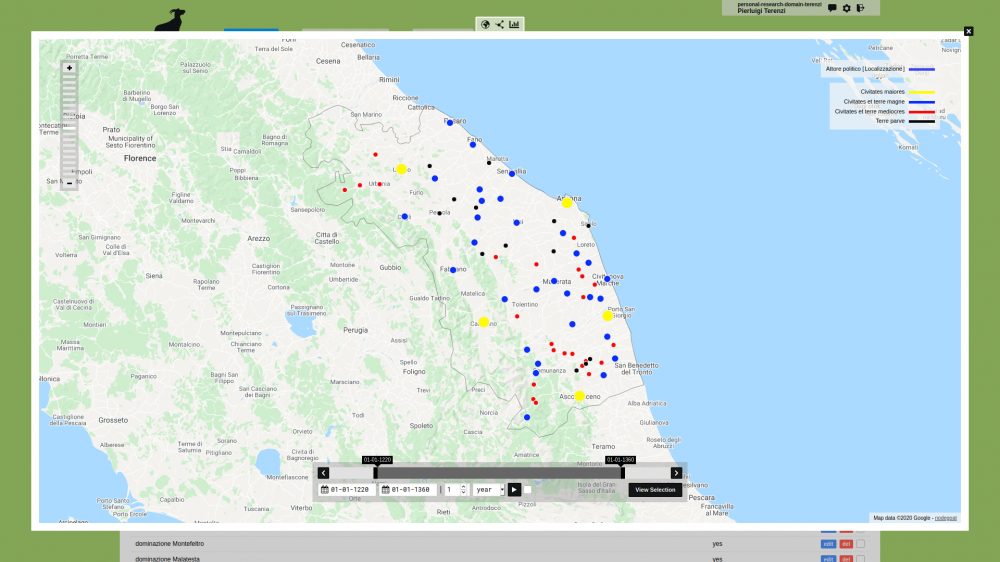
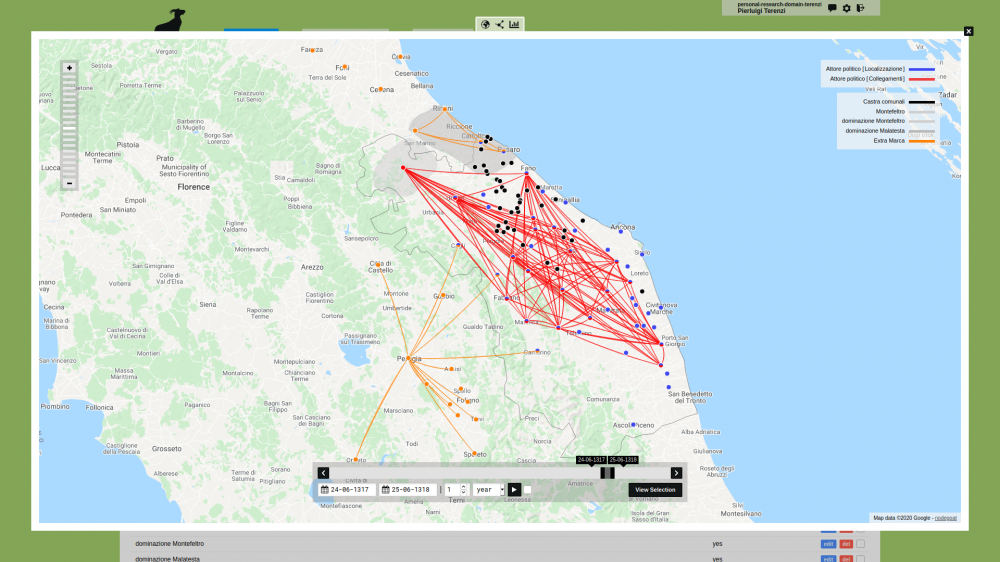
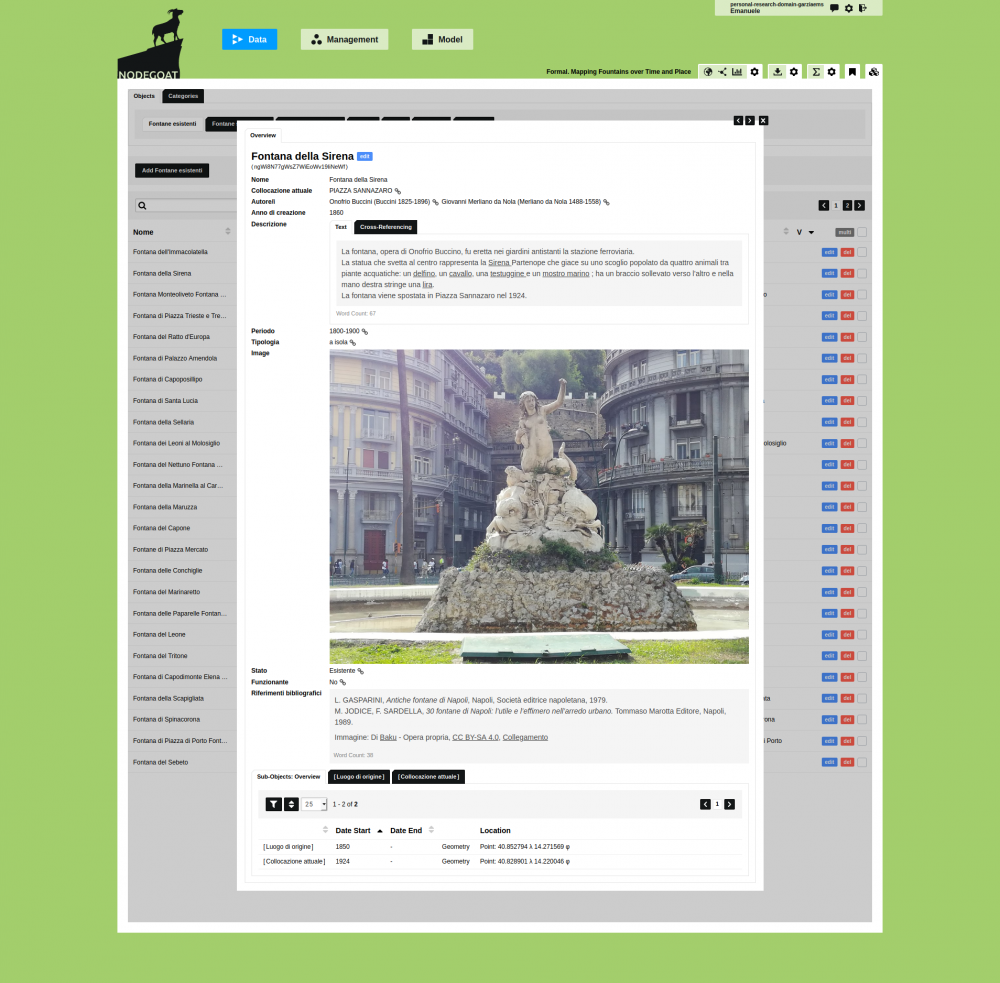
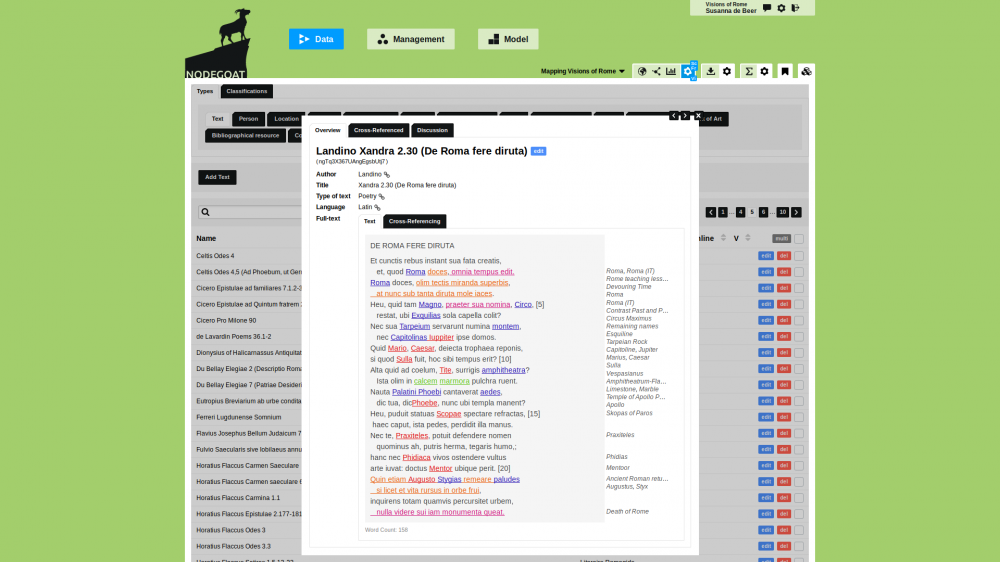
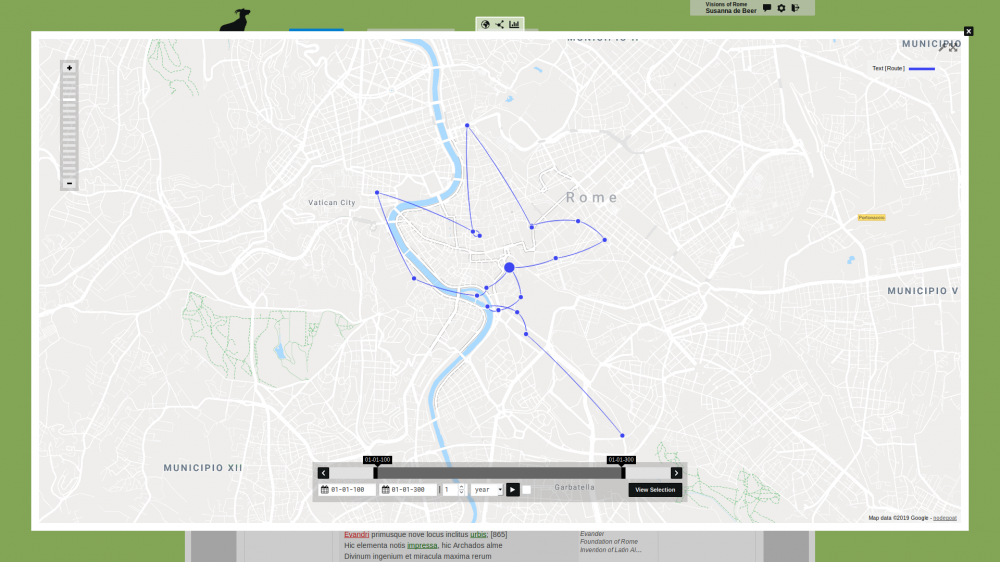
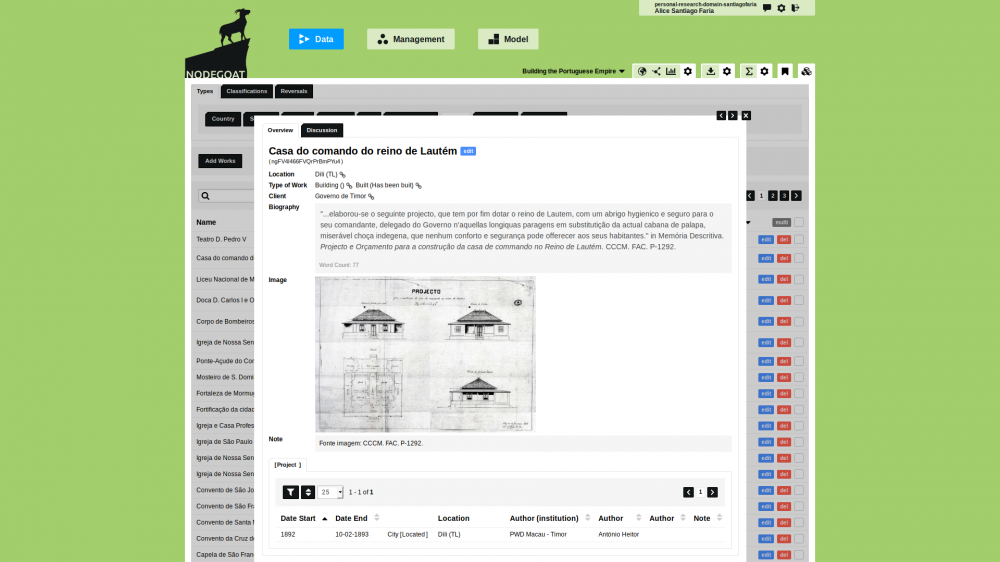
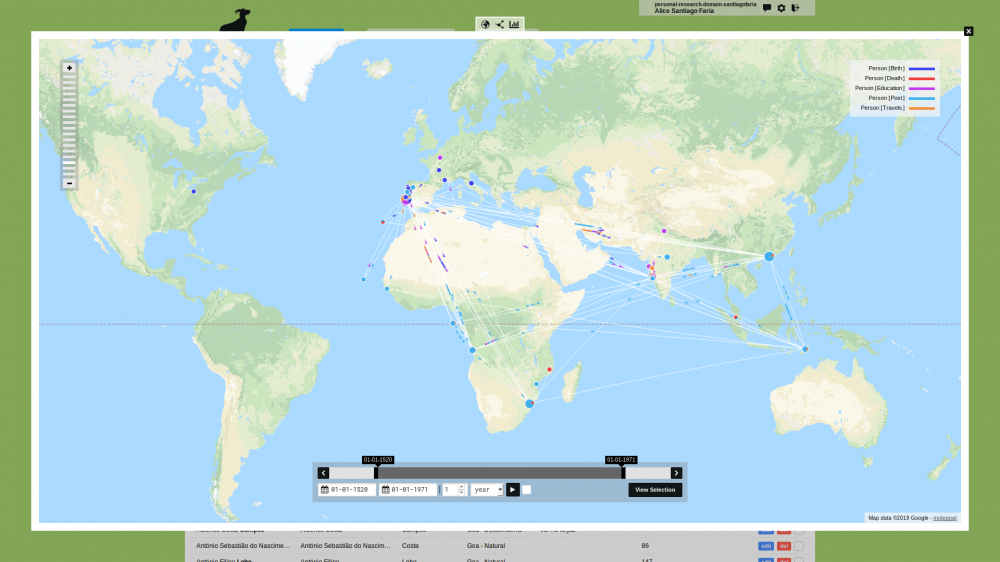
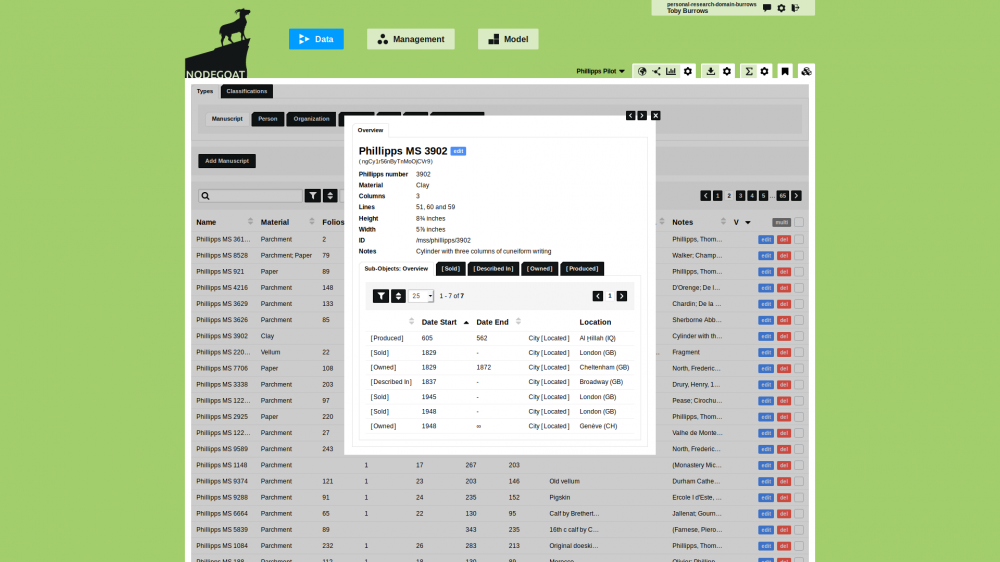
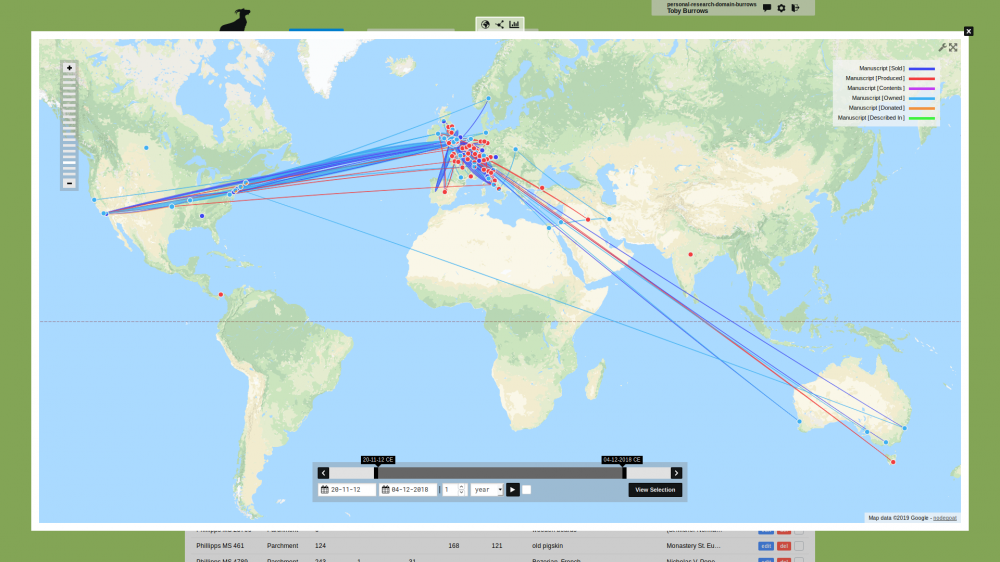
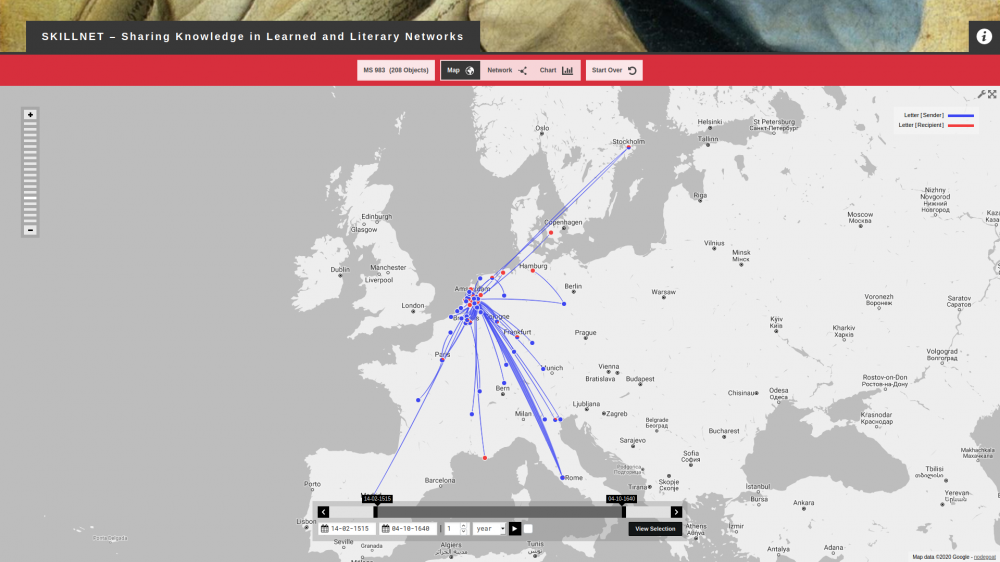
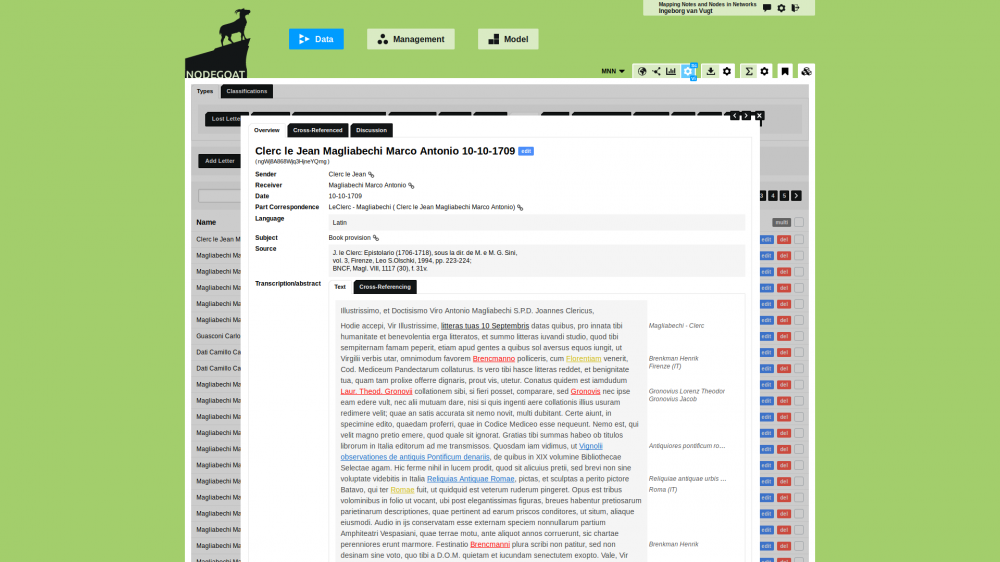
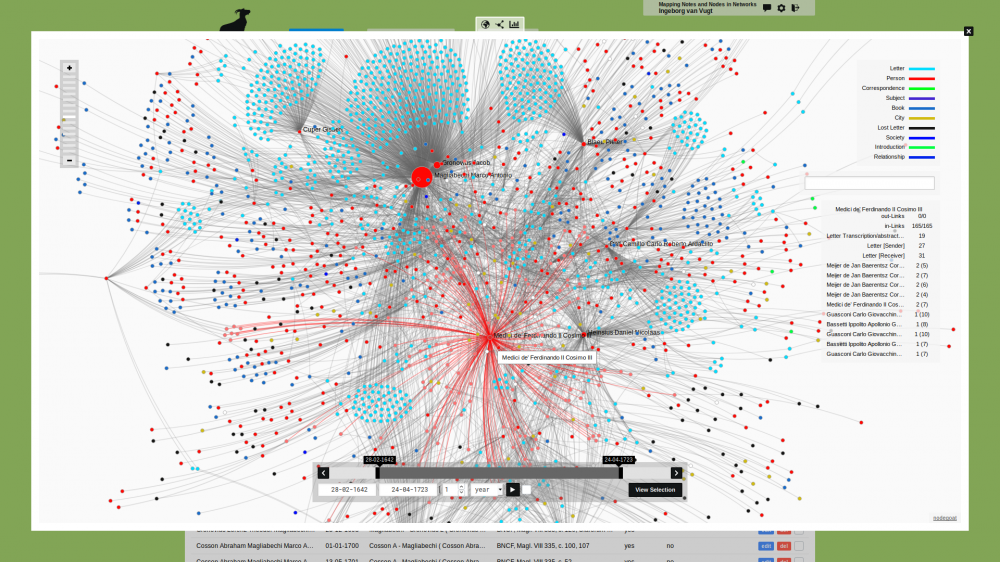
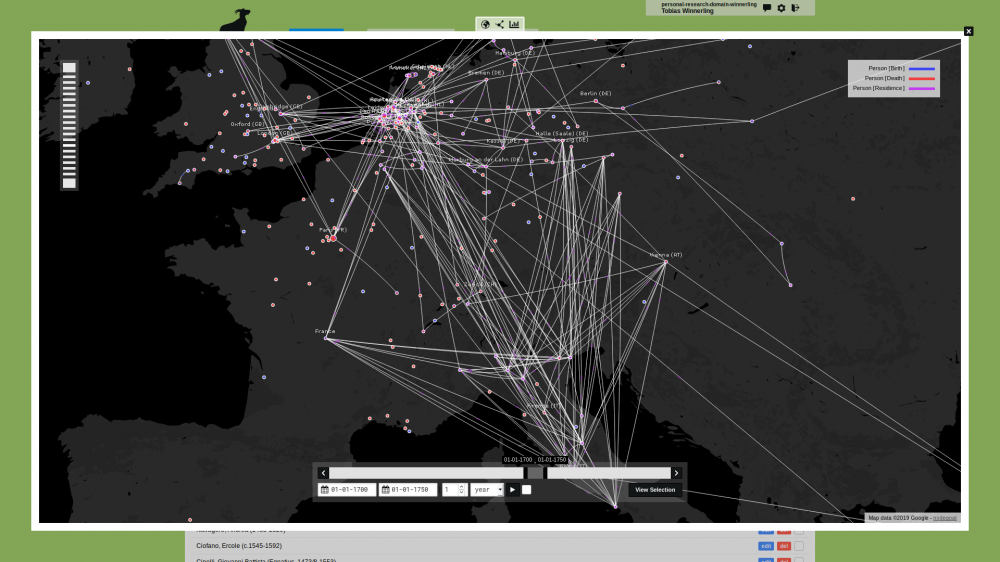
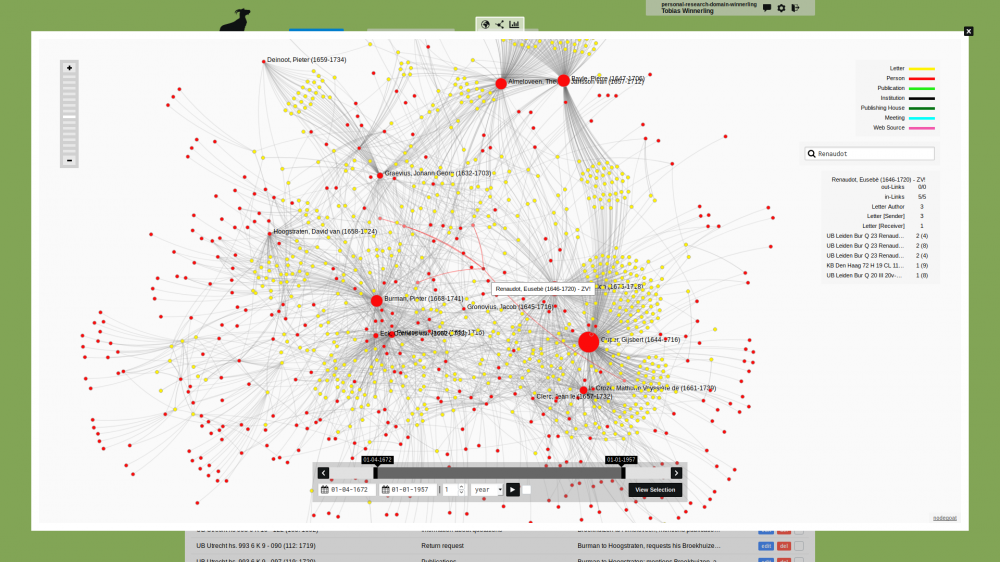
The project makes use of a database built with nodegoat (https://www.lasi.unifi.it/vp-6-database.html), consisting of two pillars: the objects Workers and Decisions. In the former, all information regarding the Opera’s workers is recorded (names, qualifications, wages, periods, etc.); in the latter, all decisions made by the Opera’s governing board regarding labour and workers (size of wages, number of workers, support for injured workers, etc.). The connection between the two pillars made it possible to analyse the relationship between the ‘labour policy’ of the Opera and the configuration of the workers, as well as the contribution of the latter to the success in the construction of the Florence Cathedral through their participation in some decision-making processes.
Project website: https://www.lasi.unifi.it/
Publications:
I cantieri pubblici dopo la Peste nera. Lavoro, accountability e impatto sociale (secoli XIV-XV), ed. by P. Terenzi and M. Bellucci, Firenze, Edifir, 2024 [PDF].
C. Nitti, M. Bellucci, P. Terenzi, G. Manetti, Insights from the management and accountability practices of the Florence Cathedral construction site (1353-1382), series Working Papers - Business of the DISEI Department, University of Florence [PDF].[....]