Visualizing Early Nineteenth-Century Foreign Commercial Activity at Pernambuco
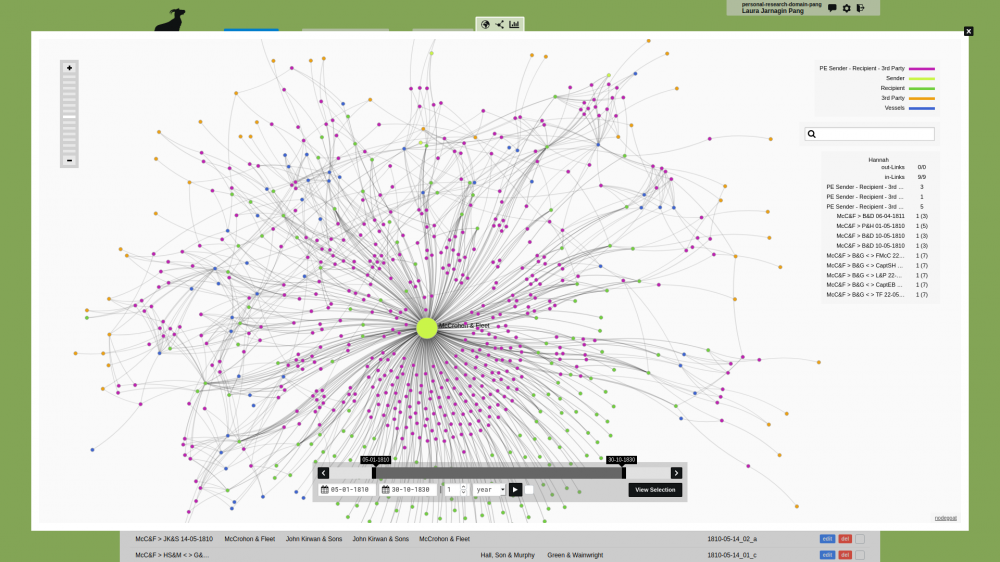
CORE AdminSocial visualization of 350 business letters sent by a foreign commission house in northeastern Brazil, 1810-1811, showing 798 nodes and 1,343 links among senders, recipients, and third parties mentioned in the correspondence, including their associations with specific vessels.Research project that documents the evolution of transnational merchant networks over time and space between the 17th and 19th centuries.
Laura Jarnagin Pang (Colorado School of Mines, Golden, Colorado, USA)I am a retired history professor who now has the amount of time to devote to research that I always craved. When I first discovered nodegoat, I didn't even know what a relational database was. I just knew that I had always dreamed of finding a way to visualize the complexities of all sorts of relationships found within extensive networks of merchants, which are the focus of my research. The nodegoat visualization samples I saw convinced me I had found the perfect medium for doing that.
My overarching research interest involves documenting the evolution of certain transnational merchant networks over time and space between roughly the latter 17th and mid 19th centuries. The many types of data this subject matter generates lend themselves to a variety of visualization opportunities. Both our perception and documentation of networks and networking can be significantly enhanced through visualizations of large amounts of data that go beyond what the written word alone can convey. Similarly, the scope, patterns, and evolution of transnational trade can be grasped quickly with geographical visualizations.
For my first nodegoat project, I focused on a subset of my research data, namely, an extensive collection of business records of an early 19th century commission house located in northeastern Brazil that was engaged in transnational commerce. Specifically, I used the outgoing correspondence generated by this firm during its first year-and-a-half in business as a window onto the international network of merchants with which it interacted. (There are no records of incoming correspondence, unfortunately.)
Some 350 letters sent by this firm contain not only sender-recipient data, but also information about third parties involved in transactions and vessels engaged in transportation. While I have entered about 85% of that information, this database is still a work in progress. Thus far it has generated some 798 nodes and 1,343 links in a social visualization projection. I have found the interconnectivity among the individuals and firms within this network to be even more extensive and dense when viewed graphically than I had been able to intuit from the written record. In nodegoat, one can easily zoom in on any given node and easily explore the linkages associated with it. Projecting that same correspondence geographically was also revelatory.
This is but one of quite a few databases I have since developed using very different foci and types of information. I often go through several iterations of database design before settling on one that best displays the phenomena I am trying to capture visually. I am still learning nodegoat and the incredible range of what can be done in it. Experimentation is key. It is also teaching me new ways to think through the data I have, especially in terms of the various diachronic relationships found within diverse types of information, and how to break down that information into categories I might not have thought to delineate otherwise.
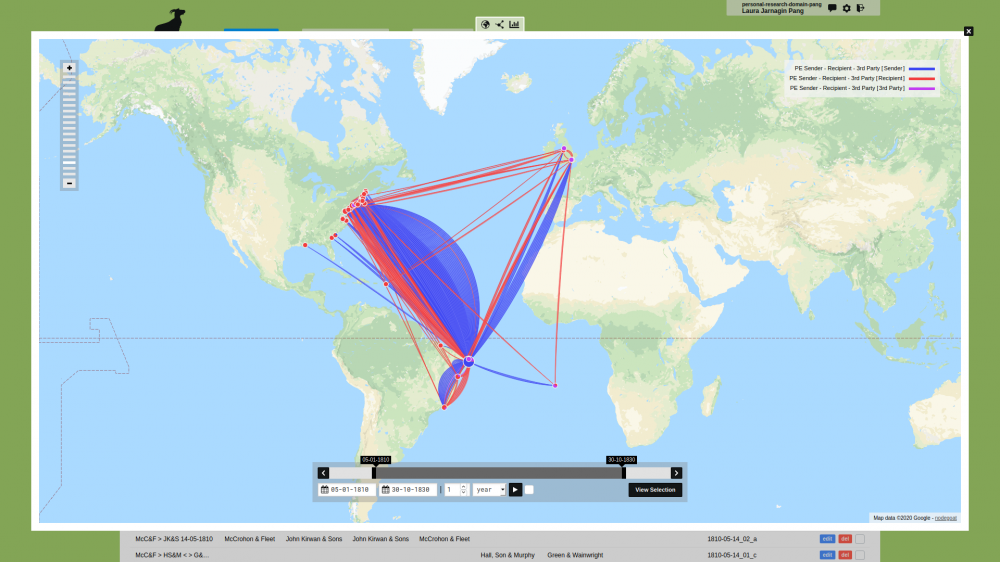
Geographical visualization of 350 business letters sent by a foreign commission house in northeastern Brazil, 1810-1811, showing the locations of the recipients and of third parties mentioned in the correspondence.