Set a Scope and Run the Analysis
Before you can run a network algorithm, you first need to specify a Scope. Follow the Guide Use the Scope to Manage the Visualisation for a basic understanding of how the Scope functions when configuring Visualisation Settings. You will see that the way you use the Scope in the Visualisation Settings is similar to configuring a Scope in the Analysis functionality.
To see this in practice, you to Data and go to the Object Type 'Person'. Click the icon on the right side of the visualisation buttons to configure a Scope that includes the Objects of the Type 'Letter'. You can do this by selecting the '🡩 [Sender] Person' reference. To exclude any references specified in the model of the Object Type 'Person' you can select the 'Object Only' option.
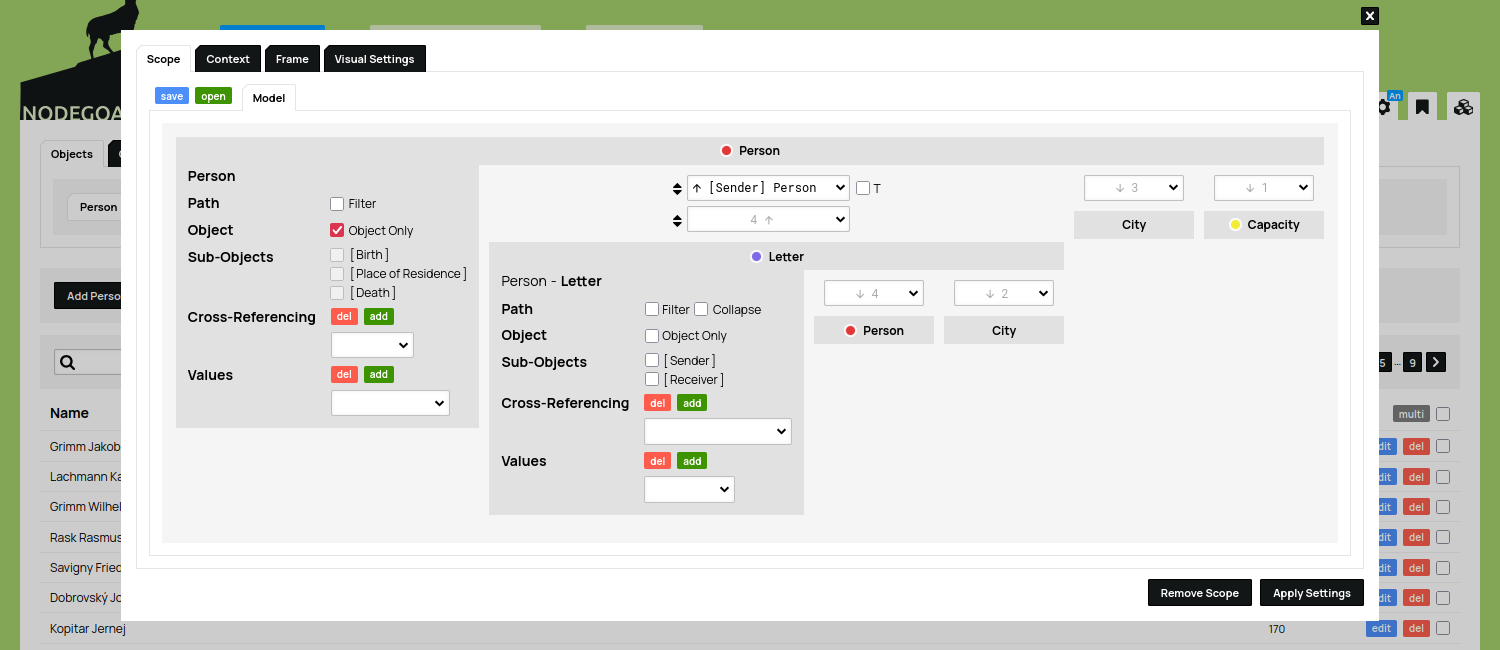
When you now run the Social Visualisation you will see all Objects of the Type 'Person' plus all linked Object of the Type 'Letter'. Since every included Object of the Type 'Letter' includes both the '[Sender] Person' reference as well as the '[Receiver] Person' reference, you will see the entire network.
Now that you understand how you can use the Scope to create paths in your data model by means of the references that you have specified in your model, you are ready to work with the Analysis functionality.
Open the Analysis Settings by clicking the icon next to the icon in the toolbar. The dialogue that opens has two tabs: 'Analyse: Person' and 'Context'. We will use the first tab to configure a Scope and algorithm that we can run on the Object Type 'Person'. This first tab has two tabs as well: 'Analyse' and 'Scope'. In the first tab 'Analyse' we leave the algorithm that has been selected by default 'Count' unchanged. In the second tab 'Scope' we see a similar Scope as we looked at before in the Visualisation Settings.
Here we implement a similar Scope as described above: set a path from the Object Type 'Person' to the Object Type 'Letter' by selecting the reference '🡩 [Sender] Person' in the drop-down menu between these two Object Types.
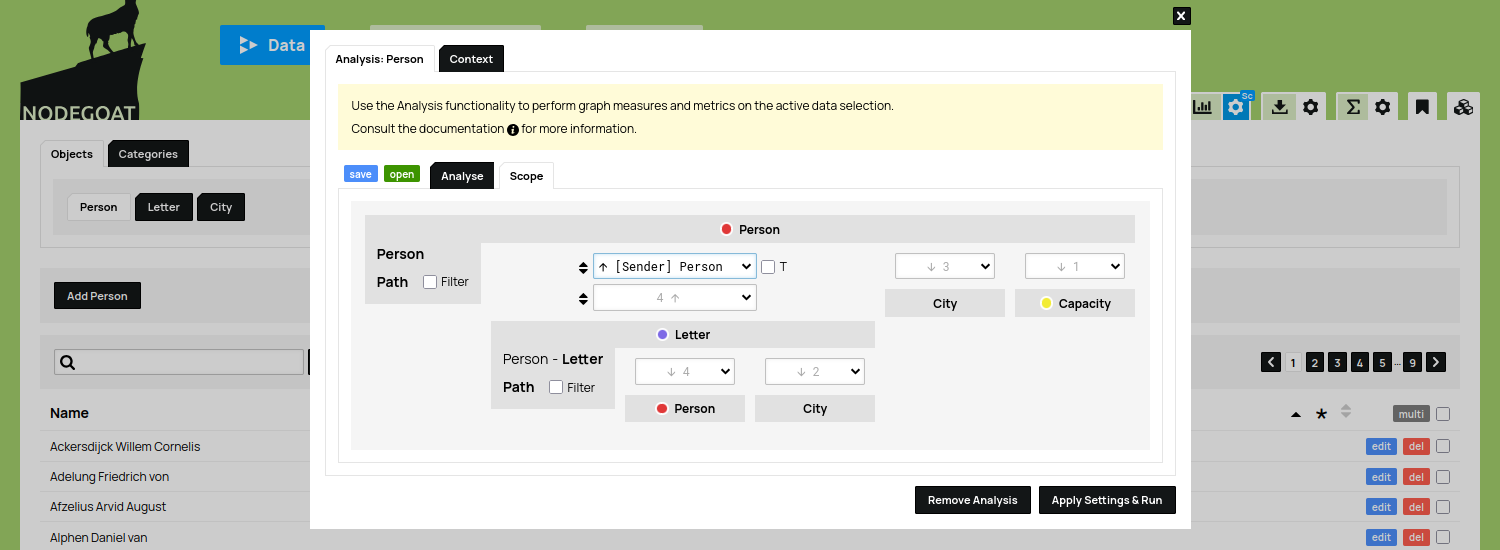
This Scope generates a unimodal graph of Objects of the Type 'Person' that are connected by edges generated by Objects of the Type 'Letter', using the '🡩 [Sender] Person' reference.
The selected algorithm 'Count' generates the amount of times the selected reference '🡩 [Sender] Person' occurs for one Object. Click 'Apply Settings & Run' to run the analysis. In the next dialogue, keep the drop-down menu next to the label 'Updated' set to '• Workspace' and click 'Run Analysis'. The analysis now runs and shows a report of the results. If you want to use this report for further analysis, click the label '[COPY REPORT]' displayed on the yellow status update to copy it to your clipboard.
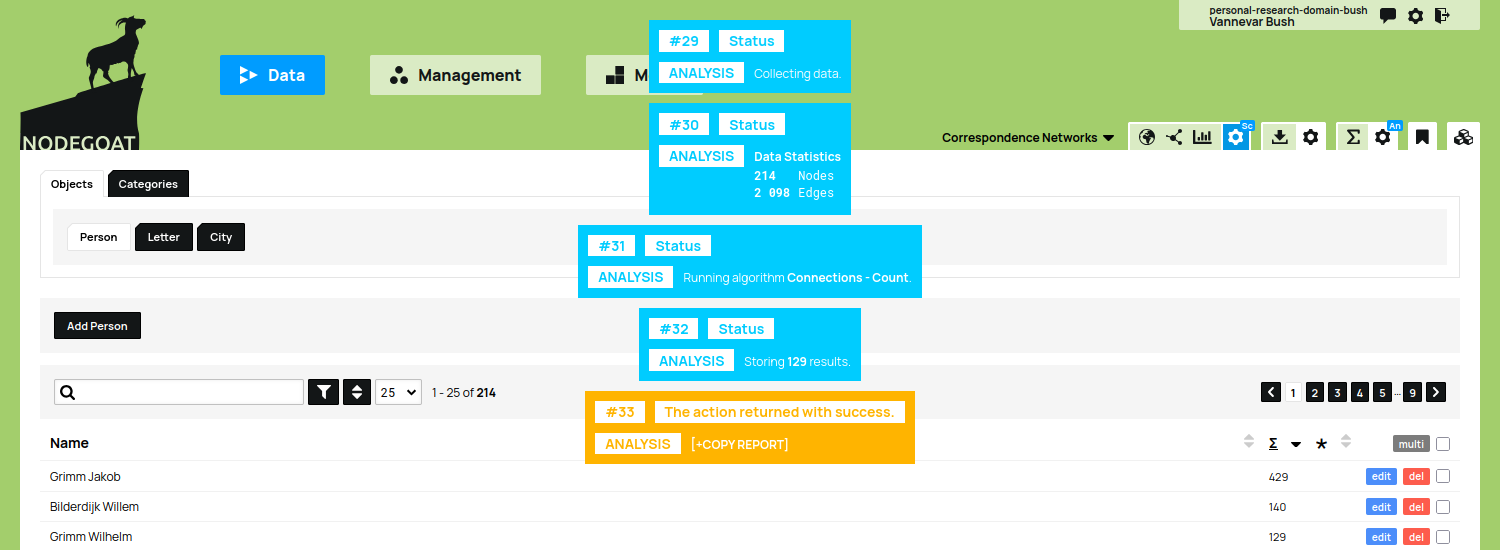
The result of the algorithm are displayed per Object in a new column that appears on the right side of the overview of Objects. Click the icon at the top of this column to sort the column on the result of the algorithm. You can also inspect the result per Object by opening the view of an Object.
Now that we have established a basic understanding on his to operate the Analysis functionality, we can run more complex algorithms. To do this, open the Analysis Settings again by clicking the icon next to the icon in the toolbar. In the tab 'Analyse' select the algorithm 'Betweenness Centrality'. Go to the tab 'Scope' and use the drop-down menu under the selected reference '🡩 [Sender] Person' to select the reference '🡩 [Receiver] Person'. This Scope generates a unimodal graph of Objects of the Type 'Person' that are connected by edges generated by Objects of the Type 'Letter', using the '🡩 [Sender] Person' and '🡩 [Receiver] Person' reference.
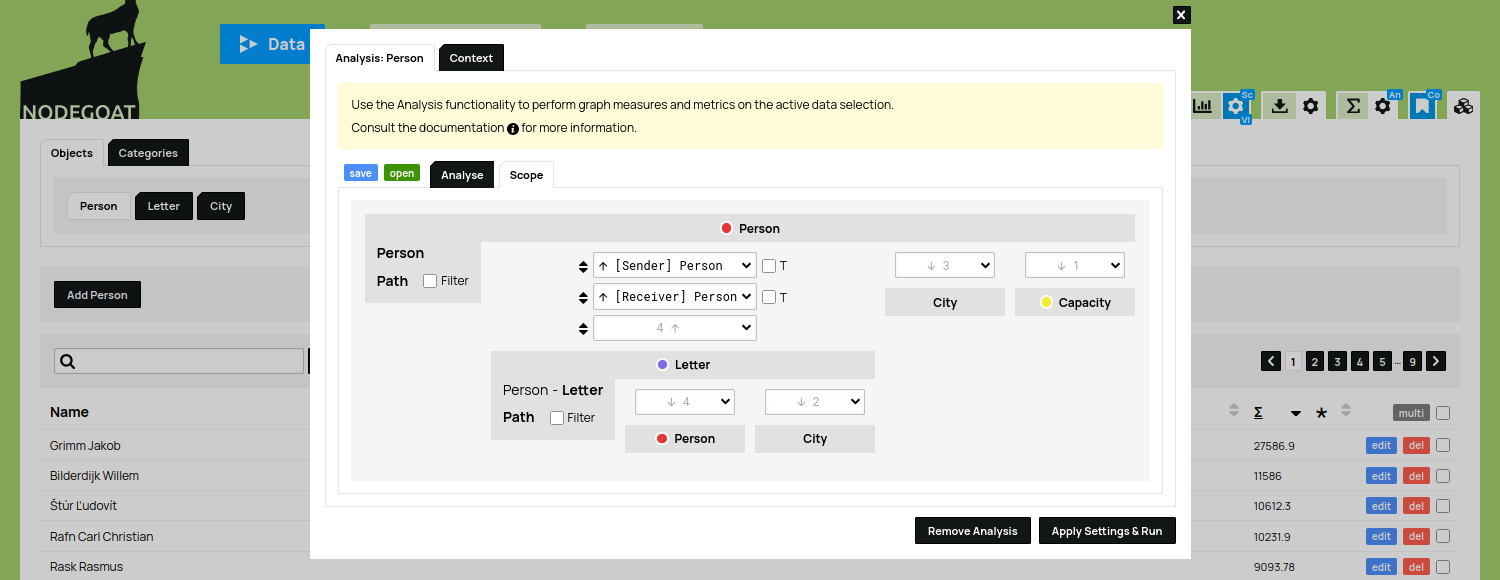
Click 'Apply Settings & Run' to run the analysis. In the next dialogue, keep the drop-down menu next to the label 'Updated' set to '• Workspace' and click 'Run Analysis'.
The next Guide Use the Analysis Result as the Weight of a Node will guide you through using the results of the algorithm to set the size of nodes in visualisations.