Run the Social Network Visualisation
Go to Data and go to the tab 'Objects'. Open the Object Type 'Letter' to view the Objects in this Type. Currently there is only one Object available.
The Visualisation buttons are located in the toolbar at the right top corner of the Data section. You run the Social Visualisation by clicking this icon.

The basic principles and and controls of this visualisation are the same as the ones described in the Guide Run the Geographic Visualisation.
Click the icon to run the Social Visualisation. Depending on the resolution of your screen, you will see something like this:
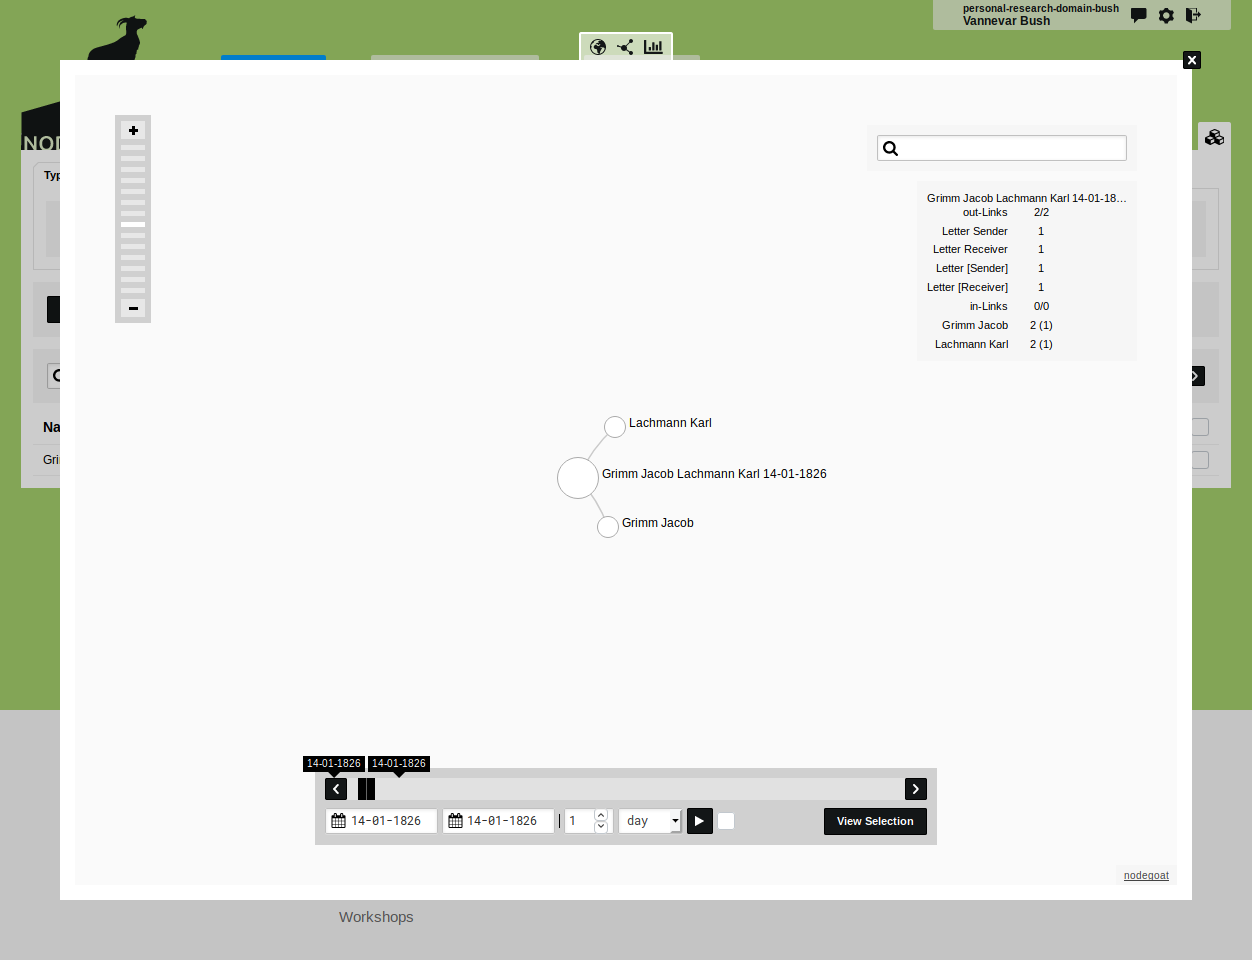
Hover over the nodes and click on the nodes to display additional information about the data behind each node. You can grab the nodes to move them to a fixed position. Drag them again to release the fixed position.
The lines are based on relationships between Objects and Categories, as defined by Object Descriptions and Sub-Object Descriptions.