Use a Historical Map
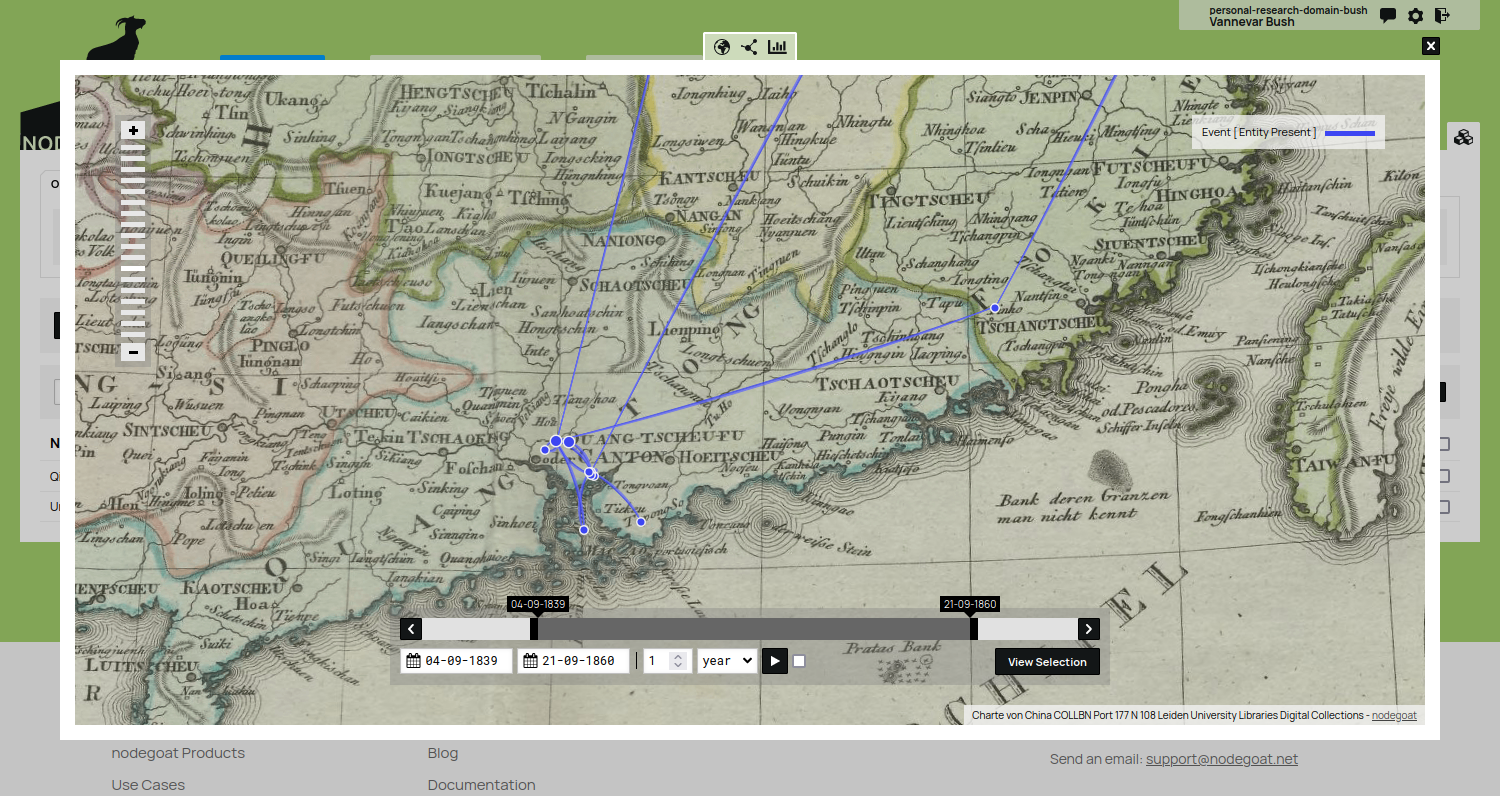
When you run the geographic visualisation in nodegoat, you see your data plotted on a map. This map is generated by means of map tiles that are provided by an external service. You can use any service that provides map tiles for this purpose. This guide will show you how to use the Allmaps service in order to display historical maps in your geographic visualisation.
Generate the Map Tiles
Allmaps is a service with which you can georeference any map that has been published in accordance with the International Image Interoperability Framework (IIIF). Once you have found a map with a IIIF manifest, you can use the Allmaps Editor to georeference the map.
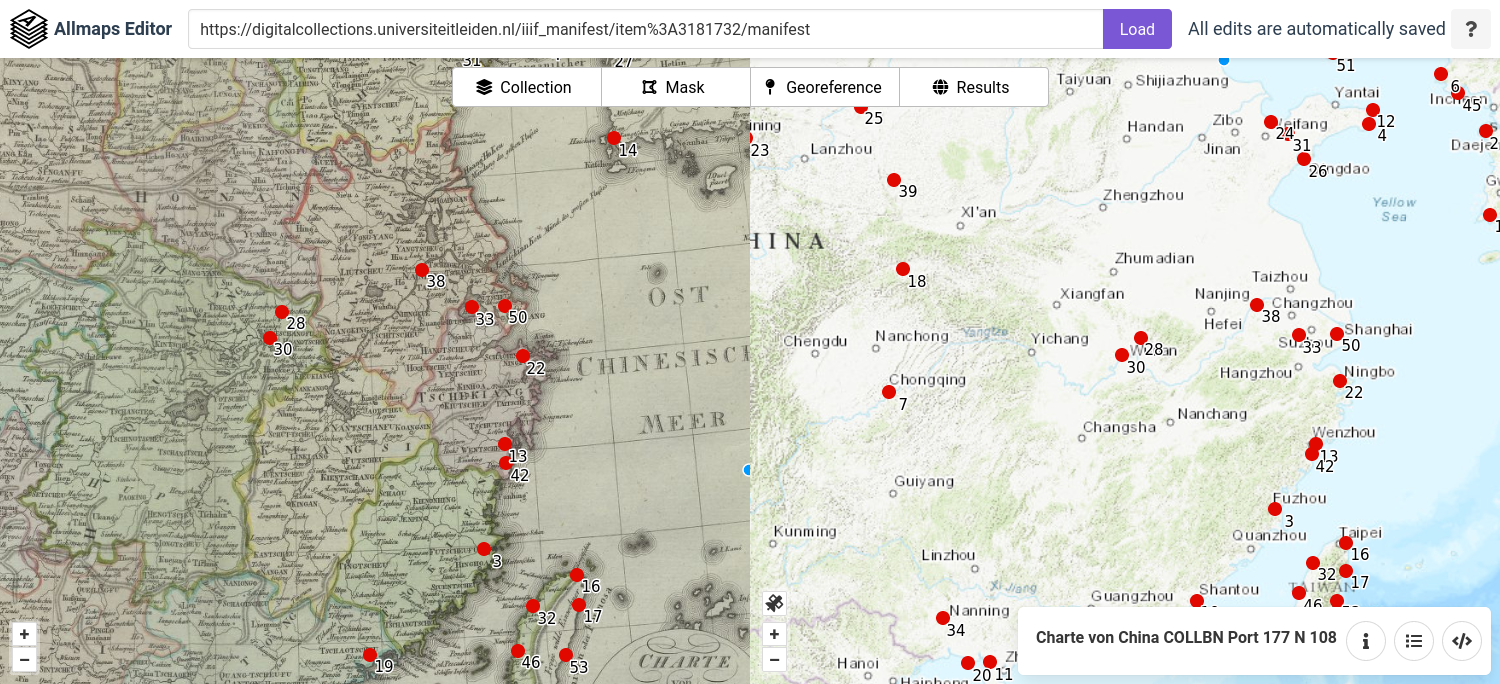
Inspect the outcome of this process in the 'Results' section of the Allmaps editor. Click the green 'Export' button to find the map tile URL generated by the Allmaps Tile Server, e.g. 'https://allmaps.xyz/images/9fef5358d1830875/{z}/{x}/{y}@2x.png'. The Allmaps Tile Server transforms the IIIF tiles to XYZ map tiles. Copy this URL to get a direct link to the tiles of this map.
Configure your Visualisation Settings
Go to your nodegoat environment and click the icon that is displayed on the right side of the visualisation buttons ('Visualisation Settings'). Go to the tab 'Visual Settings' and open the tab 'Geographical'. Find the 'Map' label and paste the URL you copied from the Allmaps editor results section into the first input field. Enter information about the map in the second input field.
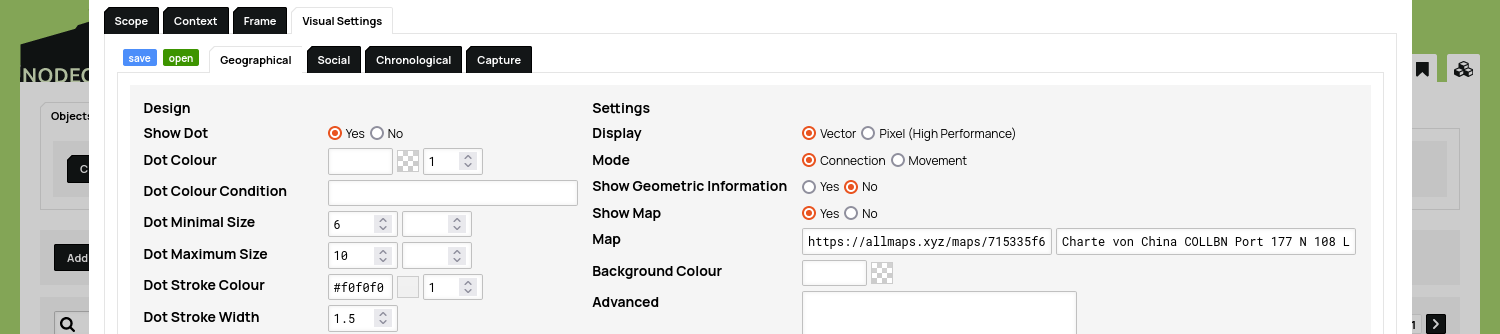
Click 'Save Settings'. This map is now displayed whenever you run the geographical visualisation.
Upload your own Map
In order to make use of an image that has not been published a with a IIIF manifest, you can use a service like IIIF Hosting to publish your image with a IIIF manifest. Create an account and upload your image. You can then navigate to the IIIF viewer, and copy the URL. Paste the URL into the Allmaps editor, add the affix /manifest.json, and make sure it uses the https protocol. Follow the steps described above to generate the map tiles and use them in your nodegoat environment.