Export data to Observable
If you want to visualise data that you created in nodegoat in a data visualisation application, you can export your data as a CSV file or query the nodegoat API. In both cases, you end up with one or multiple files that you then can process and work with in a data visualisation application.
This guide describes a more dynamic approach: use the interactive notebooks of the data exploration platform Observable to pull in data from your nodegoat environment. This approach allows you to use nodegoat as your primary data store and instantly update the visualisation application whenever you want to load in the most recent version of your data.
In this guide we will show how temporal patterns can be explored by creating alternative visualisations of correspondence data of nineteenth century European intellectuals. This dataset is a subset of a data collection of the Study Platform on Interlocking Nationalisms of the University of Amsterdam.
To make this work, first configure the API of your research environment in such a way that you can run queries to fetch the data you want to use in your visualisation application. You should have enabled at least one project in the API settings, and you should have configured at least one active client and one active user who has access to the enabled project.
The identifiers of Objects, Object Types, Scopes, or Filters (and any other nodegoat element) are shown under the name of the element when you edit or view the element. You will use these identifiers to construct the API queries.
If you do not have access to the API module that can be accessed via 'Management', please contact the administrator of your nodegoat environment or send a message to support@nodegoat.net.
We recommend to first run your query as a cURL command to confirm that the requested data is correctly returned. For example:
curl https://nodegoat.io/data/type/[Your Object Type ID]/object?limit=1 -H 'Authorization: Bearer [Your Passkey]'Connect Observable to nodegoat
Create a new notebook and create a new cell that fetches data from the nodegoat API. The response data is then formatted as JSON.
data = fetch('https://nodegoat.io/data/type/[Your Object Type ID]/object', {method: 'GET', headers: {'Authorization': 'Bearer [Your Passkey]','Content-Type': 'application/json'}}).then((response) => response.json())You can also store your passkey as a secret in your settings. You can then refer to the stored secret.
data = fetch('https://nodegoat.io/data/type/[Your Object Type ID]/object', {method: 'GET', headers: {'Authorization': 'Bearer '+Secret('nodegoat-demo'),'Content-Type': 'application/json'}}).then((response) => response.json())Now that you have this data available in your notebook, you can parse it in order to create various kinds of visualisations. As we are interested in temporal patters, we insert a new cell to parse the Objects and group them by date.
letters = {
// Go to the position in the response data that contains the list of returned nodegoat Objects
const objects = data['data']['objects'];
// Create an JavaScript object to store the dates
const dates = {};
// Iterate over the returned nodegoat Objects
for (const object_id in objects) {
const object = objects[object_id];
// Ignore nodegoat Objects without a date
if (!object['object_definitions']['163']) {
continue;
}
const date = object['object_definitions']['163']['object_definition_value'];
if (!dates[date]) {
// Create a new JavaScript object for every unique date
dates[date] = {'amount': 1, 'names': [object['object']['object_name']], 'date': new Date(date)}
} else {
// Increase the amount for every additional letter on a recurring date
dates[date]['amount']++;
// Add the name of every additional letter on a recurring date
dates[date]['names'].push(object['object']['object_name']);
}
}
// Convert the JavaScript object to an array.
return Object.values(dates);
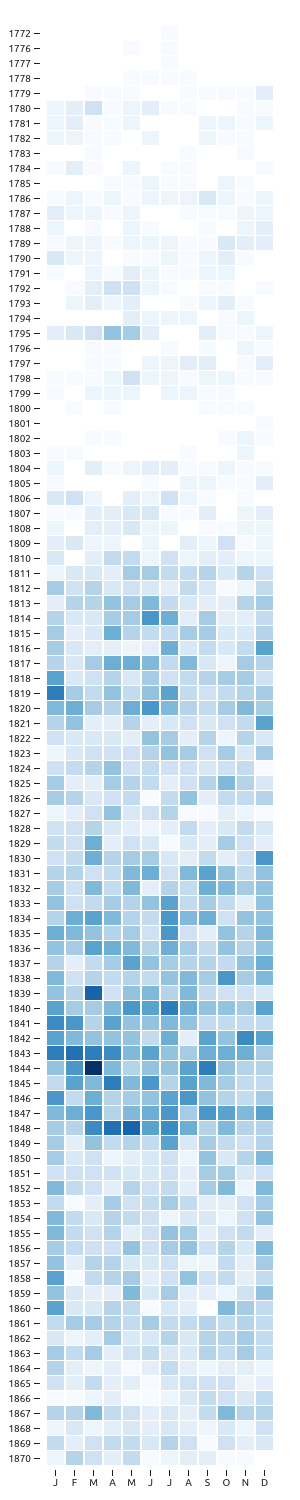
}Finally we insert a new cell and use the Observable Plot visualisation library to generate a visualisation of this data. Use the following code to group the letters by month. This allows you to explore seasonal patterns.
Plot.plot({
width: 300, // Set the width of the visualisation
height: 1500, // Set the height of the visualisation
color: {
scheme: 'blues' // Select a color scheme
},
y: {
tickFormat: '' // Render the date labels as strings
},
x: {
tickFormat: i => 'JFMAMJJASOND'[i] // Render a label per month
},
marks: [
Plot.cell(letters, Plot.group({fill: 'sum'}, { // Use the cell mark combined with a group transformation on the 'letters' data
x: d => d.date.getUTCMonth(), // Use the months for the x-axis
y: d => d.date.getUTCFullYear(), // Use the years for the y-axis
title: d => d.names.join('\n') // Use the names of the letters as the title
}))
]
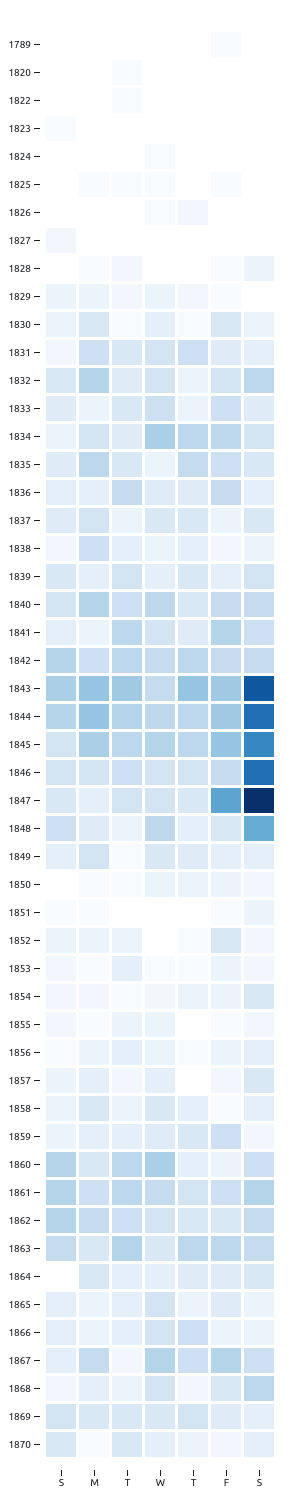
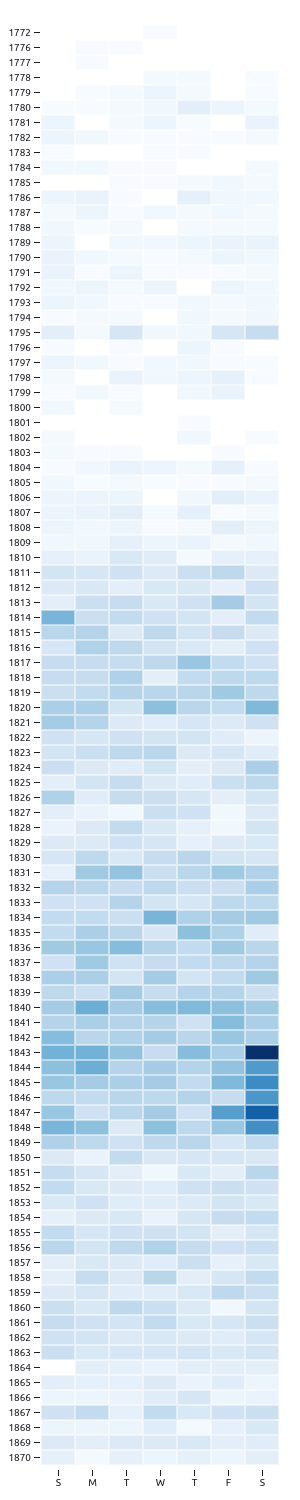
})Change the 'tickformat' of the x-axis to x: {tickFormat: i => 'SMTWTFS'[i]} and the data of the x-axis to x: d => d.date.getUTCDay() to change this visualisation to a day of the week perspective.
 |  |
These kinds of visualisations can be applied to other types of nodegoat datasets as well (e.g. migration data, transaction data).
Add Interactivity
To explore subsets of your nodegoat data, you can use a filter in your query. Another possibility is to add a cell in your notebook that you can use to select a part of the returned dataset. In this case we can add a dropdown menu to select a single sender.
To do so, we first need to make a list of all the unique senders. Add a new cell to parse the data that has been returned by the nodegoat API.
senders = {

  // Go to the position in the response data that contains the list of returned nodegoat Objects
  const objects = data['data']['objects'];
  // Create an array to store the senders
  const arr = [];
  // Create an array to keep track of the identifier of each sender
  const arr_ids = [];

  // Iterate over the returned nodegoat Objects
  for (const object_id in objects) {

    const object = objects[object_id];

    // Ignore nodegoat Objects without a sender
    if (!object['object_definitions']['161']) {
      continue;
    }

    const sender_name = object['object_definitions']['161']['object_definition_value'];
    const sender_id = object['object_definitions']['161']['object_definition_ref_object_id'];

    // Add the sender to the array of senders only if the identifiers has not been recorded
    if (!arr_ids.includes(sender_id)) {
      arr_ids.push(sender_id);
      arr.push({id: sender_id, name: sender_name});
    }
  }

  // Sort the array alphabetically
  arr.sort((a, b) => a['name'].localeCompare(b['name']));

  return arr;
}
Now that this list exists, you can add a new cell that generates a dropdown menu based on this list.
viewof sender = Inputs.select(senders, {label: "Select a Sender", format: x => x.name})To limit the letters, add an additional condition in the cell that parses the letters
if (sender.id &&
  object['object_definitions']['161'] &&
  sender.id !== object['object_definitions']['161']['object_definition_ref_object_id']) {
  continue;
}