Use the Scope to Manage the Visualisation
Go to Data, click on the tab 'Objects' and open the Object Type 'Letter'
When you run the visualisation, you visualise all the data associated with the Objects of the currently selected Type. You can limit or expand this data by specifying a 'Scope' for the visualisation. To specify a Scope, click the icon on the right side of the visualisation buttons. This opens the 'Visualisation Settings' dialog. The first tab allows you to specify a Scope for the visualisation with which you can expand or limit the data included in the visualisation.
Limit the data included in the visualisation
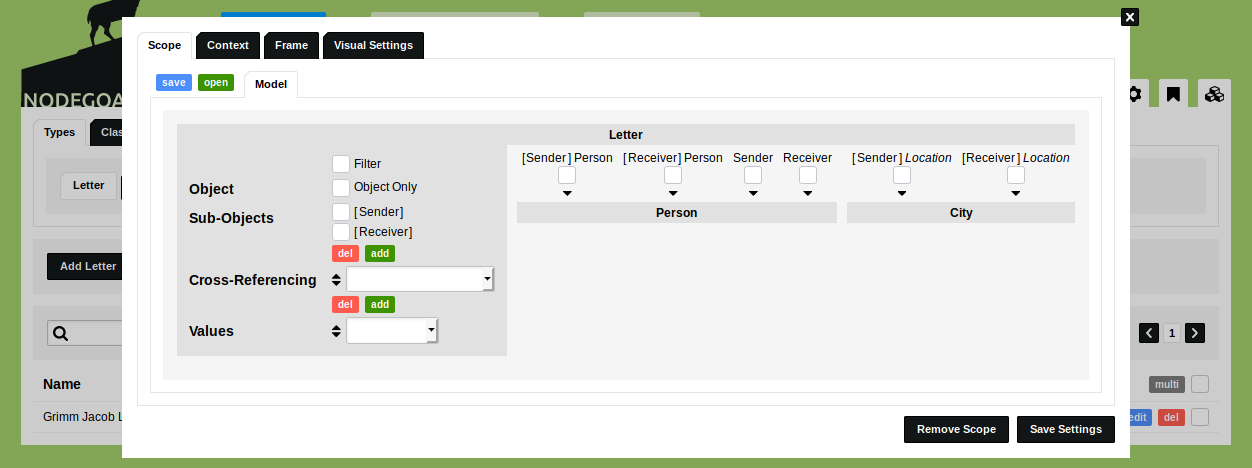
The top level of the Scope is the currently selected Object Type, in this case 'Letter'. By default, all the data in the Sub-Objects and Object Descriptions is visualised. On the left side of the dialog you see the Sub-Objects and Object Descriptions ('Cross-Referencing' Object Descriptions or Object Descriptions that contain 'Values') listed. By checking a Sub-Object checkbox or selecting an Object Description from the drop-down menu, you include these Sub-Objects and Object Descriptions in the visualisation. Once one item is checked or selected, all unchecked or unselected items will be excluded.
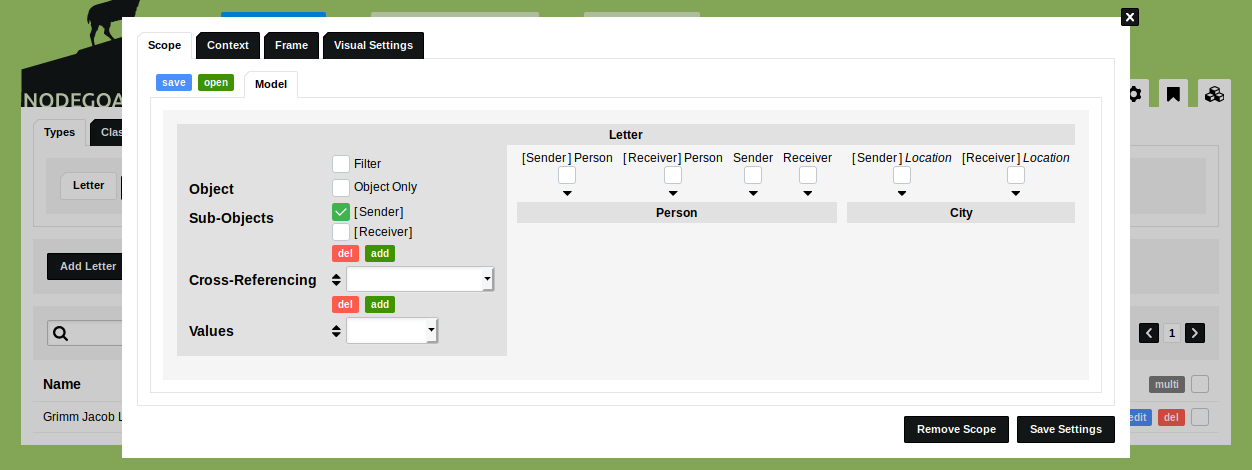
If you only want to visualise the 'Sender' Sub-Object, you check the checkbox for this Sub-Object and leave the other items unchecked/unselected:
Click 'Save Visualisation Settings' to save these settings and click the icon to run the Geographic Visualisation. You now see that only the 'Sender' Sub-Object has been visualised.
Close the visualisation and click the again. Uncheck the checkbox for the 'Sender' Sub-Object.
Expand the data included in the visualisation
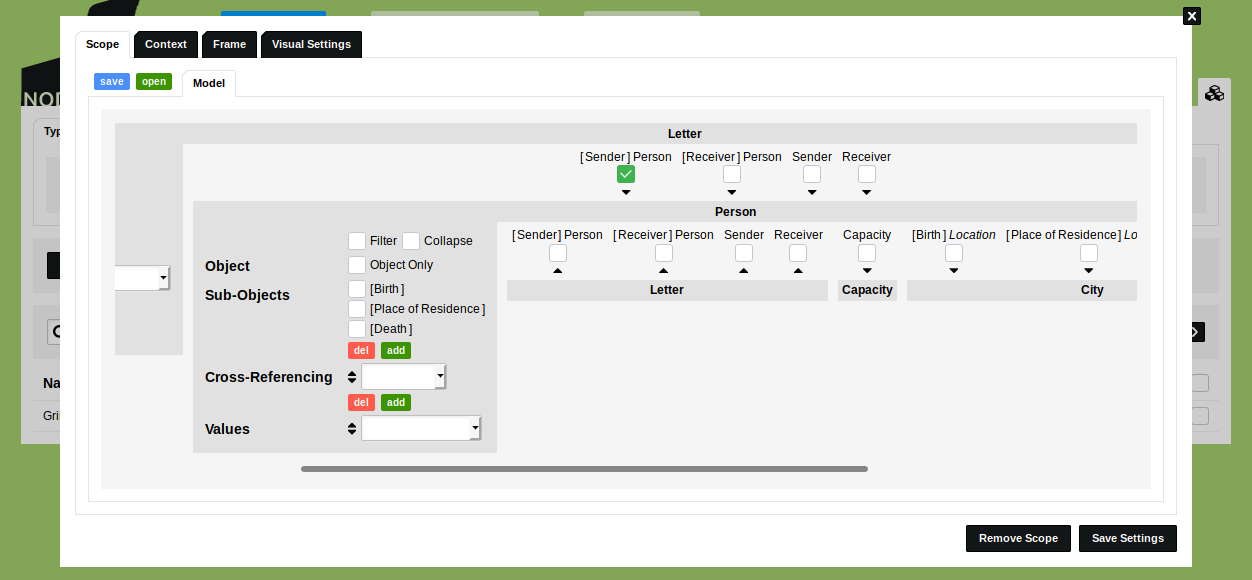
On the right side of the Scope tab in the Visualisation Settings dialog you see all the available relationships to/from other Object Types and Classifications, as you specified in the data model. Here we see six Cross-Referencing relationships. Four outgoing relationships go to the Type 'Person' (two via the Sub-Object Descriptions '[Sender] Person'/'[Receiver] Person' and two via the Object Descriptions 'Sender'/'Person'). Two outgoing relationships go to the Type 'City' ('[Sender] Location'/'[Receiver] Location'). Outgoing relationships are shown by means of the icon. By checking the checkboxes that are displayed at each relationship, you include the data of related Objects in the visualisation. Limit and expand this in the same manner as described above.
Check the checkbox at the relationship Letter [Sender] Person Person. The settings for the Type 'Person' are now displayed. Leave these settings to their default values.
Click 'Save Visualisation Settings' to save these settings and click the icon to run the Geographic Visualisation. You now see that all the data of the related Objects in the Type 'Person' has been included in the visualisation.
Compare this to the Scope of the Object Type 'Person'
Open the Object Type 'Person' and open the Visualisation Settings of this Type by clicking the icon on the right side of the visualisation buttons.
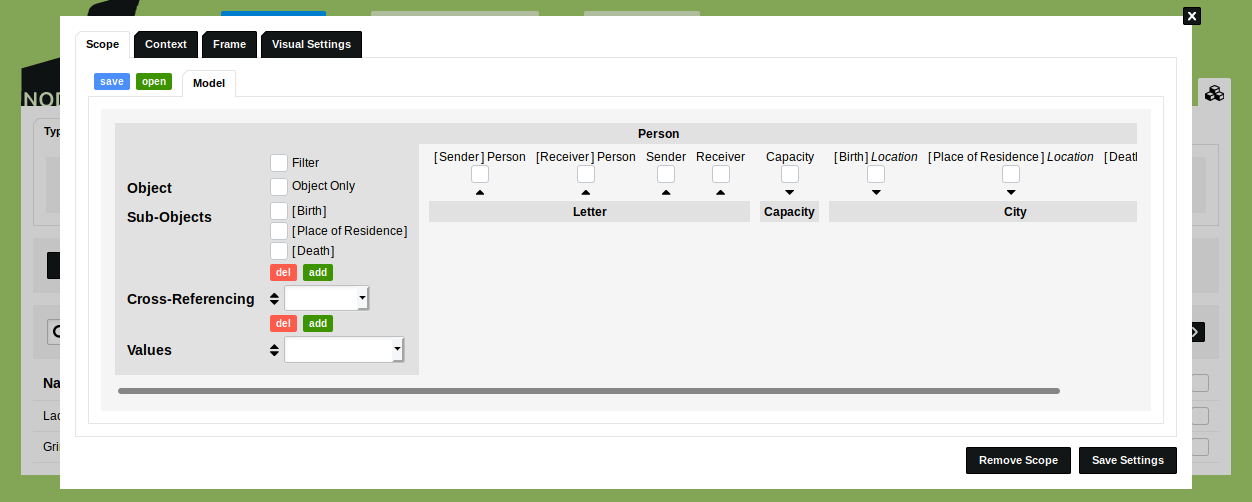
On the left side of the Scope tab in the Visualisation Settings dialog you see the Sub-Objects and Object Descriptions that can be used to limit the data that will be included in the visualisation. On the right side you see the relationships to/from other Object Types and Classifications, as you specified in the data Model. Here you see incoming relationships from the Type 'Letter', indicated by means of the icon. Outgoing relationships, indicated with the icon, are also available here. One to the Classification 'Capacity' and three to the Type 'City'.
To explore this functionality you can close this dialog and click the icon to run the Social Visualisation. You will now only see two unconnected persons. This happens because your Data Model does not include direct relations from ‘Person’ to ‘Person’. Open the Visualisation Settings of this Type by clicking the icon on the right side of the visualisation buttons again. You will notice that there are neither incoming nor outgoing relations to ‘Person’. But you know that both Jacob Grimm and Karl Lachmann are connected to each other because your dataset contains a letter written by Jacob Grimm to Karl Lachmann.
By defining a Scope you can use this letter to visualise this connection in the Type ‘Person’.
To do so, first check the two boxes ‘Sender’ and ‘Receiver’ below ‘Person’. These relate to the Object Descriptions ‘Sender’ and ‘Receiver’, in the Type 'Letter' and are therefore incoming relationships, as indicated by the icon. Now the data from the object ‘Letter’ will be included in the visualisation, and the settings for the type ‘Letter’ are displayed. Click 'Save Visualisation Settings' to save these settings and click the icon to run the Social Visualisation. You will see that the persons are connected: two persons who each have one connection to a letter. Explore this further by opening the Scope again to follow more relationships and use the 'Collapse' functinality to collapse nodes into lines (e.g. to transform a bimodal network of people and letters into a unimodal network by collapsing the nodes of letters into lines between persons).
The Scope can be used like this to explore your dataset following any sort of relationship between your Types.