There will be a nodegoat community meeting at the Mundaneum (Paul Otlet ftw) in Mons (Belgium) on July 1. This meeting is an initiative of the TIC project at the University of Ghent in cooperation with DARIAH-BE. The meeting follows on the doctoral workshop 'Tracing Mobilities & Socio-political Activism. 19th-20th centuries' that takes place at the Mundaneum between June 29 and July 1.
The nodegoat community meeting will start with a general introduction on the current status of nodegoat and upcoming new features. Next, we will have four presentations of projects that make use of nodegoat:
The following interactive visualisation explores the movements of 10.896 Representatives of the United States Congress, from Roger Sherman's birth in 1721 up until all its members in 2015. The Representatives move from their place of birth to their place of education and finally to their possible place of death. Click here to open the interactive visualisation.
Last April, we gave a talk at the tenth Historical Network Research workshop in Düsseldorf about the 'Reversed Classification' functionality in nodegoat. To illustrate what you can accomplish with this functionality, we queried Wikidata to get a dataset of all the members of the US House of Representatives, including their date and place of birth and death, their professions, and the institutes where they took their education. We used this data to perform a reversed classification process that groups the representatives into career politicians or politicians with a heterogeneous career. From there, you could start looking at geographical patterns or educational backgrounds of these groups. See a graph of this network with these two 'career' nodes included here (canvas).
The diachronic geographical visualisation of all this data in nodegoat turns out to be a nice bonus.
On the first day, we will host a nodegoat workshop. This workshop will last half a day and is titled 'Advanced HNR' (it will run in parallel with an introductory historical network research workshop by Martin Stark). Since we only have half a day, we encourage participants who have not used nodegoat before to watch our three tutorials that cover basic functionalities of nodegoat.[....]
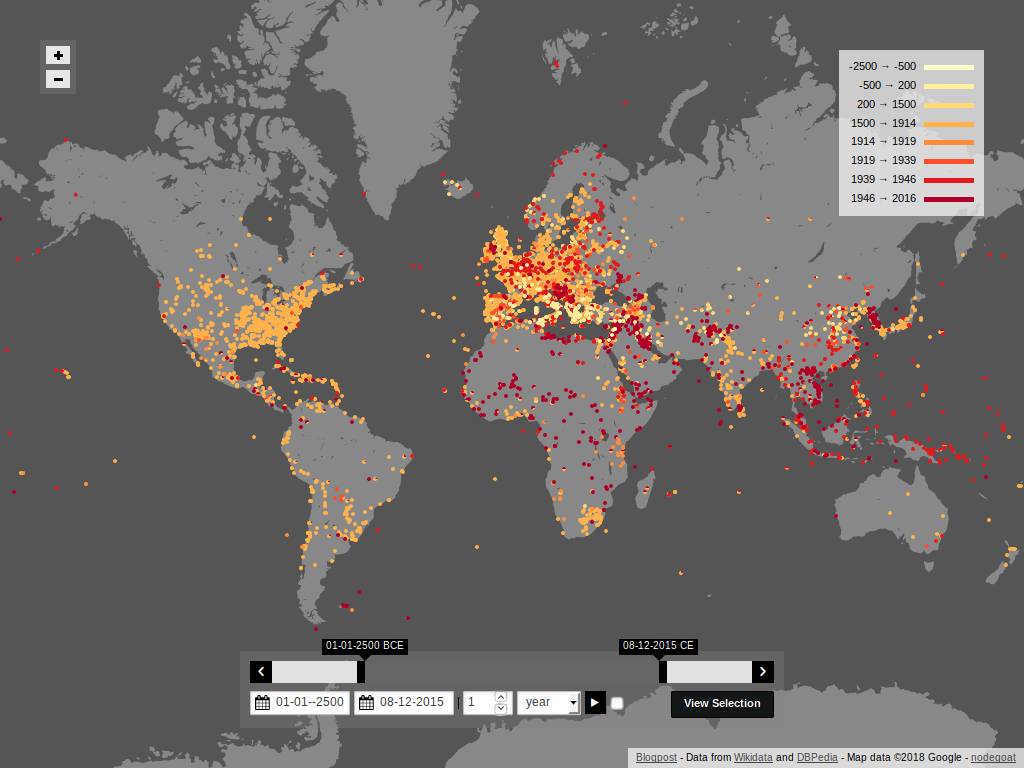
From the outside, it can be a challenge to keep up with all the developments within the ever expanding universe of wiki*/*pedia. So it's good to be reminded now and then of all the structured data that has become available thanks to their efforts:
This looks pretty neat, especially since Wikidata currently has over 947 million triples in their data store. Since battles usually have a place and a date, it would be nice to import this data into a data design in nodegoat and visualise these battles through time and space (diachronic geospatiality ftw).[....]
This week we gave a two-day workshop on data modeling and database development for historians. This workshop was part of the course Databases for young historians. This course was sponsored by the Huizinga Instituut, Posthumus Instituut, Huygens-ING and the Amsterdam Centre for Cultural Heritage and Identity (ACHI, UvA) and was hosted by Huygens-ING.
We had a great time working with a group of historians who were eager to learn how to conceptualise data models and how to set up databases. We discussed a couple of common issues that come up when historians start to think in terms of 'data':
How to determine the scope of your research?
How to deal with unknown/uncertain primary source material?
How to use/import 'structured' data?
How to reference entries in a dataset and how to deal with conflicting sources?
How to deal with unique/specific objects in a table/type?
These points were taken by the horns (pun intended) when every participant went on to conceptualise their data model. To get a feel for classical database software (tables, primary keys, foreign keys, forms, etc..), they set up a database in LibreOffice Base. Finally, each participant created their own data model in nodegoat and presented their model and first bits of data.[....]
You can now use nodegoat to query SPARQL endpoints like Wikidata, DBpedia, the Getty Vocabularies (AAT, ULAN, TGN), and the British Museum. Through the nodegoat graphic interface you query linked data resources and store their URIs within your dataset. This means that you can search all people in Wikidata using the string 'Rembrandt' and select the URI of your choice (e.g. 'https://www.wikidata.org/wiki/Q5598'). By doing so, you add external identifiers to your dataset and introduce a form of authority control in your data. This will help to disambiguate objects (like persons/artworks with similar names) and also enhances the interoperability of your dataset. Both these aspects make it easier to share and reuse datasets.
These two advantages (data disambiguation and data interoperability) are useful for researchers who work on small(-ish) but complex datasets. Researchers who feel that 'automated' research processes are unattainable for them as their data may be dispersed, heterogeneous, incomplete, or only available in an analogue format, are more likely to rely on something like the old fashioned card catalogue system in which all relevant objects and their varying attributes and relations are described. Luckily, we can also use digital tools to create and maintain card catalogues (databases). For a historian who is mapping the art market of a seventeenth century Dutch town, a database is a very powerful tool to store and analyse all objects (persons, artworks etc.) and the relations between these objects. Still, if no external identifiers are used, this dataset is nothing but a curated island (even if the data is published!).
Curation Island
Curation & Linked Data
The process we describe here aims to connect the craftsmanship of research in the humanities to the interconnected world of massive repositories, graph databases and authority files. Other useful purposes of linked data resources for the humanities have already been described extensively, like using aggregation queries to analyse large collections, thesaurus comparison/matching, or performing automated metadata reconciliation as described by the Free Your Metadata initiative.[....]
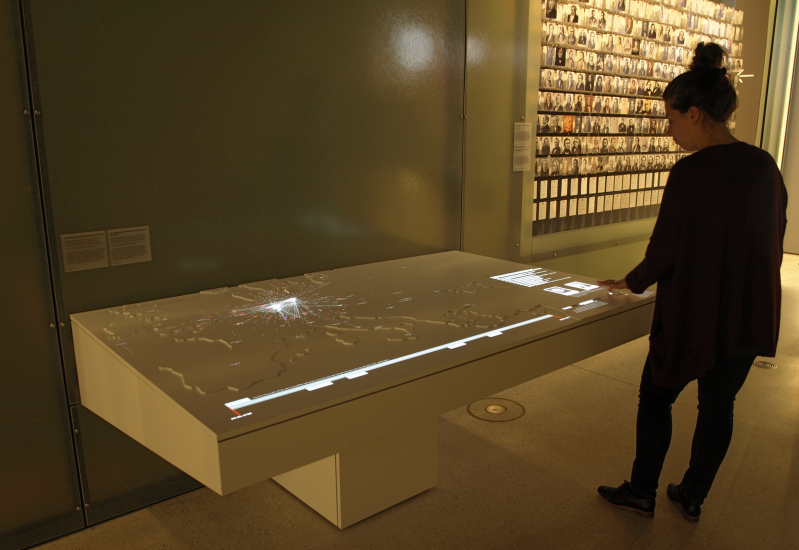
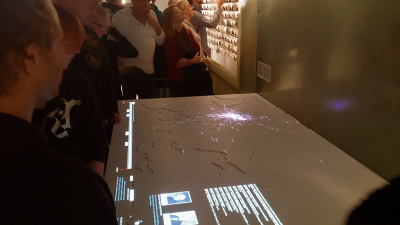
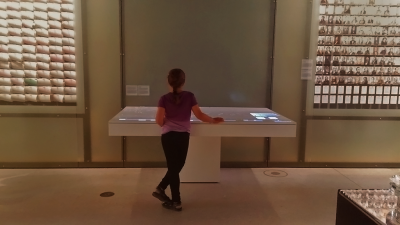
The installation is located in the first section of the permanent exhibition. The wooden table has a cut-out (elevated) map of Europe as its surface. The visualisation is projected by a Barco F35 projector (WQXGA resolution). Visitors can interact with the installation by means of capacitive sensors.
We have developed an interactive installation for the new GRIMMWELT museum in Kassel, Germany. The installation visualises and lets visitors freely interact with the full correspondence network of Jacob and Wilhelm Grimm, involving a total of 20.000 letters and 1400 correspondence partners in a timespan of 80 years. The dataset of letters has been created by the Arbeitsstelle Grimm-Briefwechsel at the Institut für deutsche Literatur of the Humboldt-Universität zu Berlin. We have developed the visualisation in cooperation with SPIN: Study Platform on Interlocking Nationalisms at the University of Amsterdam.
The installation implements a new geographical visualisation mode 'Movement' in nodegoat, in addition to the already available line-based 'Connection' mode. The Movement mode uses WebGL rendering (GPU) to animate large collections of objects smoothly. This mode also allows for a wide range of configuration parameters to finetune the visualisation to various scenarios. Due to the open and generic nature of nodegoat, we can now make use of the Movement mode for any other relevant dataset.
This short clip shows the new visualisation mode from within nodegoat:
A high resolution 1440p version of this clip is available here.[....]
During this year's Text Encoding Initiative Conference in Lyon, from 26 to 31 October 2015, we will host a nodegoat workshop. The workshop will last a full day and will take place on 26 October. Register here.
In this workshop we will support participants to employ explorative visualisations based on their own TEI data by means of nodegoat. A good example of how nodegoat can be used to create, manage, visualise, analyse and present structured data is the project on romantic nationalism by Joep Leerssen of the University of Amsterdam. The public interface of this collaborative research project can be consulted via http://romanticnationalism.net, or read more about it in the brochure (PDF).[....]