Enter, Curate & Explore Data
CORE AdminWithin nodegoat we are working on combining data management functionalities with the ability to seamlessly analyse and visualise data. nodegoat can be used as any other database application as it allows users to define, update and query multiple data models. However, as soon as data is entered into the environment, various analytical tools and visualisations become available instantly. Tools such as in-depth filtering, diachronic geographical mappings, diachronic social graphs, content driven timelines, and shortest path calculation enable a user to explore the context of each piece of data. The explorative nature of nodegoat allows users to trailblaze through data; instead of working with static ‘pushes’ – or exports – of data, data is dynamically ‘pulled’ within its context each time a query is fired. This approach produces a number of advantages, opportunities, and challenges we plan to discuss in this and future blog posts.
To kick off, let’s consider an example: the provenance of paintings. Should an art historian decide to deal with this research question within nodegoat, they will first conceptualise a data model based on the kind of data that needs to be included (e.g. persons, studios, paintings, collections, museums) and the relevant relations (e.g. created by, sold by, inherited by, exhibited in). This data model then has to be set up in nodegoat and subsequently be filled with pieces of evidence (see the nodegoat FAQ to learn more about this). As soon as the first objects have been entered and their relations have been identified, these objects can be plotted on a map, be viewed in a social graph, or simply: they become part of the network. Now, a question such as ‘how is an artist connected to a specific museum via an art dealership?’ becomes tangible by using functionalities such as shortest path calculation between objects and in-depth filtering.
nodegoat runs in a web browser, making it is accessible from any device connected to the internet. Working in a web based environment allows for the implemention of collaborative projects and simultaneous access to the same dataset. Multiple users (who have been assigned varying clearance levels) can enter, update and inspect data. Using this approach, a researcher or research group can decide to design a data model in nodegoat and start entering data into this data model alone, together or with a larger group.
Like in any other database application, the data model can be as complex or as simple as needed. As the data model will be built from the ground up, it can be accustomed to any specific needs of the pieces of evidence at hand. Should new characteristics of the data emerge during the research process, the data model can be updated instantaneously. Operating nodegoat does not require programming skills or experience in using database software, everything can be done in a graphic user interface.
Once the data model has been established, it can be populated with data. Based on the fields defined in the data model, the data can consist of dates, geolocations, relations to other pieces of data, relations to categories in classifications, simple text strings, formatted or unformatted texts, media (e.g. jpegs, mp3s, pdfs) or references to external authority files. nodegoat excels when the dataset is rich in temporal, geographic and relational attributes.
For the research project on the provenance of paintings, objects can be created for each painting. Within this object, descriptions can be entered or related for the creator of the painting, the period of production, the location of production and the dates and locations associated with the subsequent changes in ownership.
In nodegoat you query your data by means of filtering functionalities. Instead of writing queries, filters can be defined within the graphic interface. These filters are always based on a custom data model that has been set up and are as complex or as simple. Also, these filters will go as deep as the connections that can be made within the data model. This allows for creating a filter like: ‘show me all the paintings that were once owned by persons born in Berlin, excluding all the paintings produced by artists who died after 1655’. As illustrated in this example, nodegoat is capable of processing complex queries as they arise during the research process. Each filter can be stored and re-used by other users and can be used for various functionalities within a research project. For instance, once a filter has been stored a user can ‘follow’ a filter and be notified when an object matching this filter has been added or modified.
Just like filters, shortest path calculations are based on the custom data model designed by the user. If the data model includes relations between curators and museums, museums and exhibitions, exhibitions and paintings, and paintings and artists, paths can be explored between a curator and an artist spanning all the relations that connect these objects.
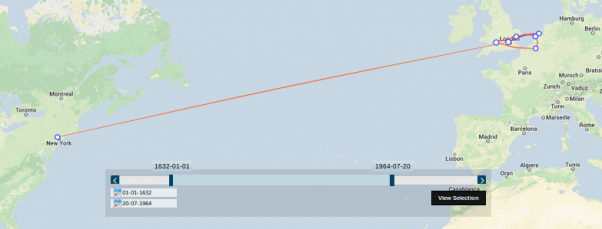
The visualisations that are available in nodegoat are fueled by temporal, geographical and relational attributes of the entered data. This makes nodegoat especially useful for research projects in the humanities as each piece of evidence can be thoroughly contextualised. Visualisations are built into the environment making them one click away. Entering the date and place of the production of a painting as well as the subsequent changes in ownership gives the user instant access to a diachronic map. Entering the relations between people produces a diachronic social graph. We experienced that for most users this workflow transforms entering data (usually quite a boring task) into a rewarding process.
Besides the seamless workflow offered by nodegoat, managing data in a web based environment opens up a number of opportunities. Data can be shared over multiple projects and simultaneously worked on by multiple users. This allows for various data entry and data curation scenarios on the same dataset. The main opportunity here is to publish outcomes of research to a wider audience. Sharing references to a dataset makes the data available for fellow scholars. As the connection between the data and the tool is always maintained, neither the tool nor the data becomes obsolete. Moreover, the original sources as well as the final visualisation are presented in the same environment.
Of course, uniting multiple functionalities may also have drawbacks. One remark we recently heard was: “you have created a totalitarian tool”. We are aware of this risk and feel that data should never exist in one tool only. To assure tool independency, nodegoat has a flexible import module and allows for extensive export scenarios. Besides loading csv or json files, this also means that users are able to export selections (or complete datasets) for further usage in visualisation tools like Gephi or Pajek.
Comments
Add Comment